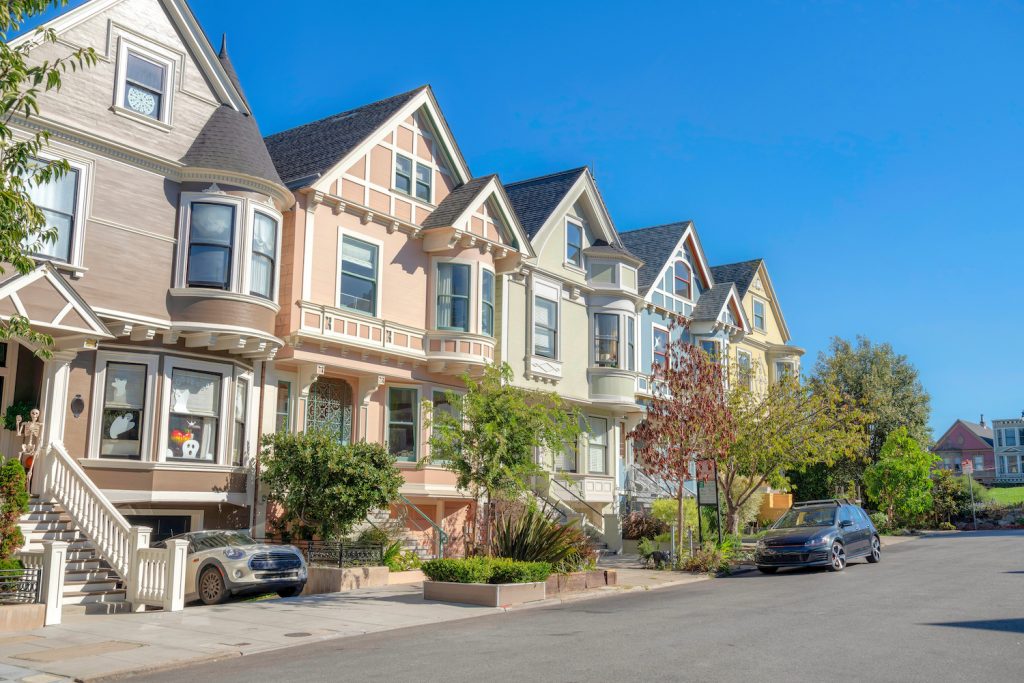
In March, the median selling price, median list price, inventory, and sale-to-list price ratio in San Francisco all increased, signaling positive growth in the real estate market. In addition, the average days on market decreased by three days to 13, which continues a downward trend that began in December 2022. Keep reading to learn more about key metrics in San Francisco and other metropolitan areas in the Bay Area.
Home prices
Mortgage calculator: Estimate your monthly payment
All calculations are estimates and provided for informational purposes only. Actual amounts may vary.
-
- Principle and interest -
- Homeowner's insurance $112
Introduce me to Flyhomes Mortgage
Inventory
Competition
Competition report
Our research team analyzed the competition in select local areas.
San Francisco includes data for the city of San Francisco.
East Bay I includes data for Oakland and Berkeley.
East Bay II includes data for Fremont, Newark, and Union City.
Tri-Valley includes data for Dublin, Pleasanton, and San Ramon.
South Bay includes data for San Jose, Santa Clara, and Sunnyvale.
Peninsula includes data for San Mateo, Foster City, Belmont, and San Carlos.
