


November 2021 highlights
Overall, the Bay Area showed consistency in most of its metrics, suggesting a more predictable market. Most notably, the number of pending homes decreased over 6%, which meant that a slight increase of inventory led to a small decrease in demand.
- San Francisco single family homes were selling for the highest prices since the summer. For most of the spring and fall, single-family homes were selling for around $1.8 million. The summertime is peak selling season so homes were going for closer to $2 million in May, June, and July. But this November, median home prices rose again to $1,925,000.
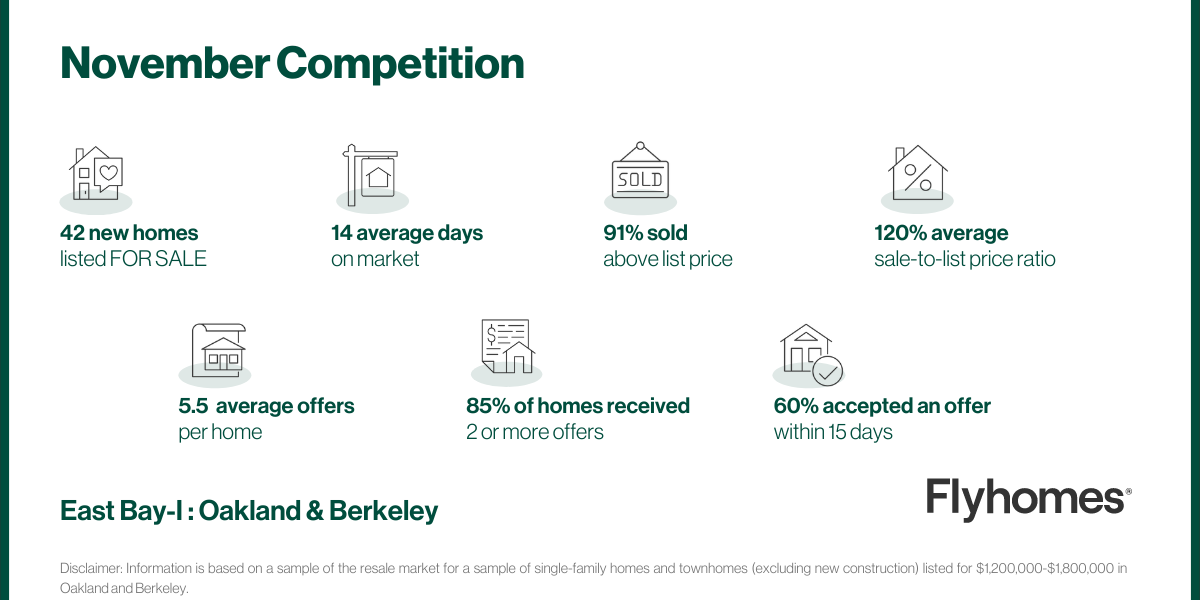
- Berkeley and Oakland (East Bay I) saw little change. Median sales prices for homes in the East Bay were predictably less than those in San Francisco proper, but unlike in the city, the sale-to-list-price ratio was higher in the East Bay. In the East Bay, homes sold for around 10% over list price.
- The Tri-Valley area remains one of the more predictable markets. Key metrics like Days on Market selling price remained largely flat in November. Homes here were on the market an average of 7 days, which was the same as the previous 5 months. Median selling price ticked up a little from $1,490,000 in October to $1,510,000 in November.
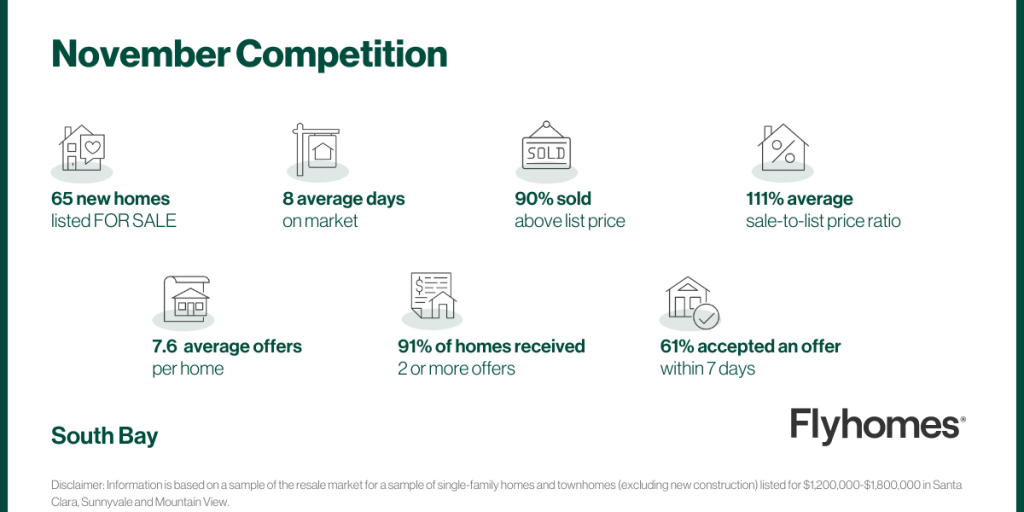
- Fewer homes were listed and sold in the South Bay. The number of listed homes decreased in November to 450 from 675 but a simultaneous dip in the homes sold kept competition even month over month. The sale-to-list-price ratio was at 109%, one of the higher for the year, while the median number days a home was on the market held steady at 8.
- Single family home prices on the Peninsula are consistently up. After a slow start at the beginning of the year, home prices on the Peninsula have steadily increased, beginning to rise again after a previous peak in August. In November, the median price for a single family home reached nearly $2.3 million.
See previous months’ highlights
Competition report
Our research team analyzed the competition in select local areas.


Sale price
List price

Sale price compared to list price
Days on market
Number of properties listed
Number of properties pending sale
San Francisco includes data for the city of San Francisco.
East Bay I includes data for Oakland and Berkeley.
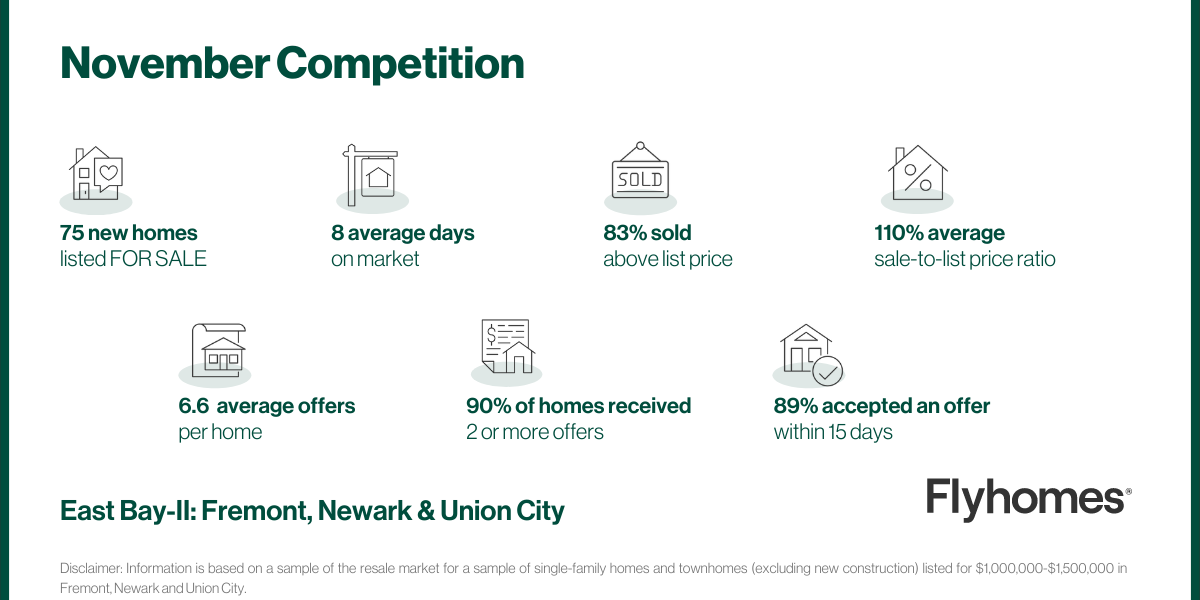
East Bay II includes data for Fremont, Newark, and Union City.
Tri-Valley includes data for Dublin, Pleasanton, and San Ramon.
South Bay includes data for San Jose, Santa Clara, and Sunnyvale.
Peninsula includes data for San Mateo, Foster City, Belmont, and San Carlos.