


November 2021 highlights
The Seattle area continued its trend toward a steadier and slower pace that began in the fall. As expected, the number of homes sold and listed were both down while the list-to-sale-price ratio was smaller at 102%. The same can be said of the Eastside where median sales prices were steady at $1.4 million.
- Seattle is in the middle of its slow season. The median days on the market for a single family home increased for the first time since January from 6 days to 7. Sales prices are down slightly in both Seattle and on the Eastside.
- The list-price-to-sale-price ratio is lower in Seattle. Homes continued to sell above list price in both Seattle and Eastside, but only the Eastside saw an increase in the ratio. Seattle homes sold for an average of 102% of the list price while Eastside homes increased from 108% to 111%.
- Condo sales continue to slide on the Eastside. Both the number of pending condos dropped on the Eastside for the sixth month in a row from a peak at 164 in May to 103 in November. The amount of listed condos also dropped heavily from 106 to 69.
See previous months’ highlights
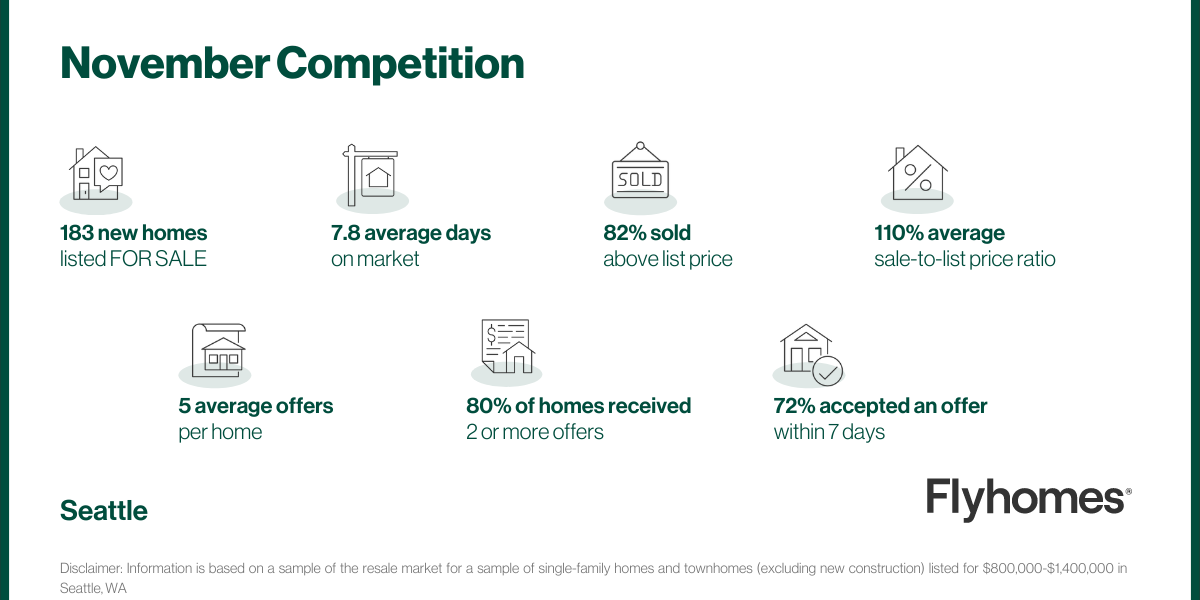
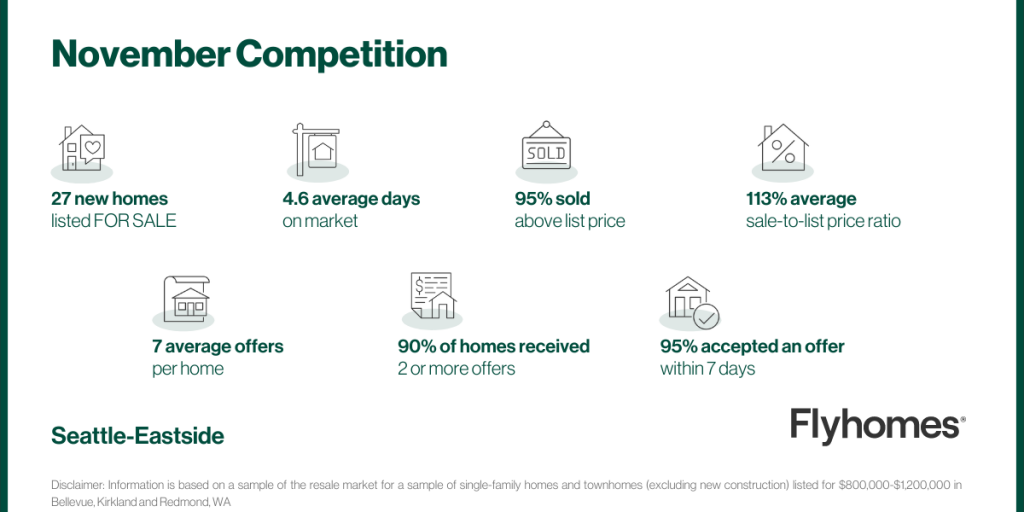
Competition report
Our research team analyzed the competition in select local areas.

Sale price
List price
Sale price compared to list price
Days on market
Number of properties listed
Number of properties pending sale
Seattle includes data for the city of Seattle.
Eastside includes data for Redmond, Bellevue, and Kirkland.