


September 2021 highlights
Across the Bay Area, buyers in September purchased homes at peak-season pace, but at lower sale-to-list ratios, indicating decreased competition. Some regions are firmly into the fall slowdown with fewer homes being listed, while others saw an inventory increase that’s likely a late attempt by sellers who want to move on before the 2021 holiday season.
Note: This month, we split the East Bay into two reports: one for Berkeley and Oakland, and one for Fremont, Newark, and Union City. We also started covering the Tri-Valley area.
- San Francisco listings up, competition down. The number of single family homes listed in San Francisco increased by 60% from August, while the number pending jumped 52%. High volume in September is typical in the city prior to a slowdown in October. Sale-to-list price ratio, meanwhile, dropped 1%. Condos also saw a 60% jump in listed volume, while the number pending increased by only 6%.
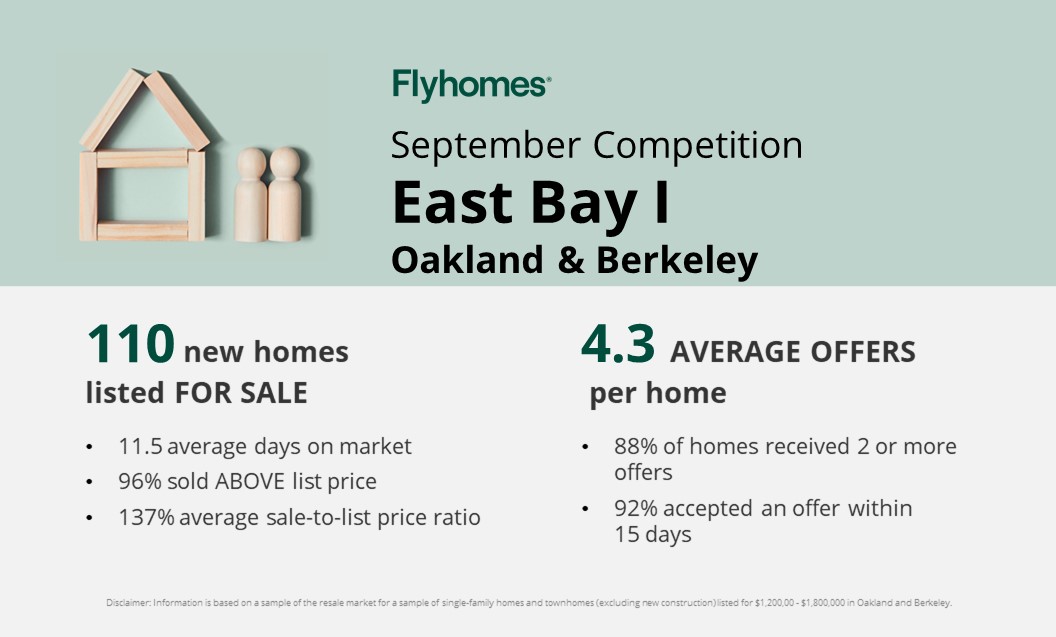
- Berkeley and Oakland (East Bay I) were still hot. 25% more single family homes were listed than in August. Buyers swept up homes quickly, with median days on market dropping 15% back to 11 days, a pace last seen at the peak in May. Median list price rose 2%, while median sale price jumped 11% and sale-to-list price ratio increased 2%.
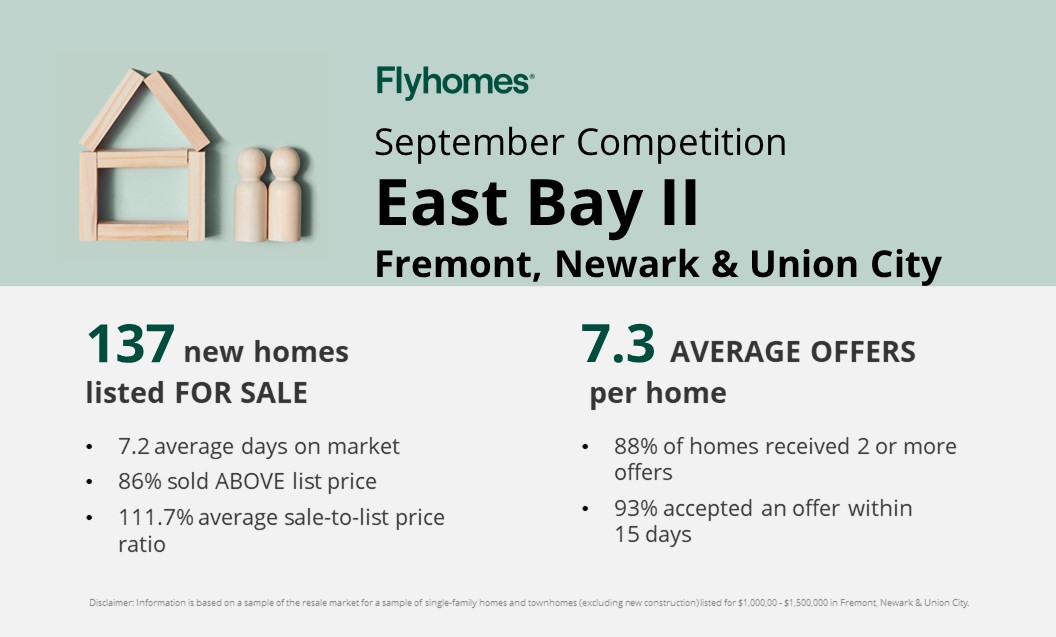
- Fremont, Newark, and Union City (East Bay II) cooled. Median sale price for single family homes stayed flat month over month as fewer homes were listed and went pending, and sale-to-list price ratio dropped 2% as competition softened. Condo sellers listed 43% more units than in August, but the number pending dropped by 8%, indicating that sellers are more eager than buyers.
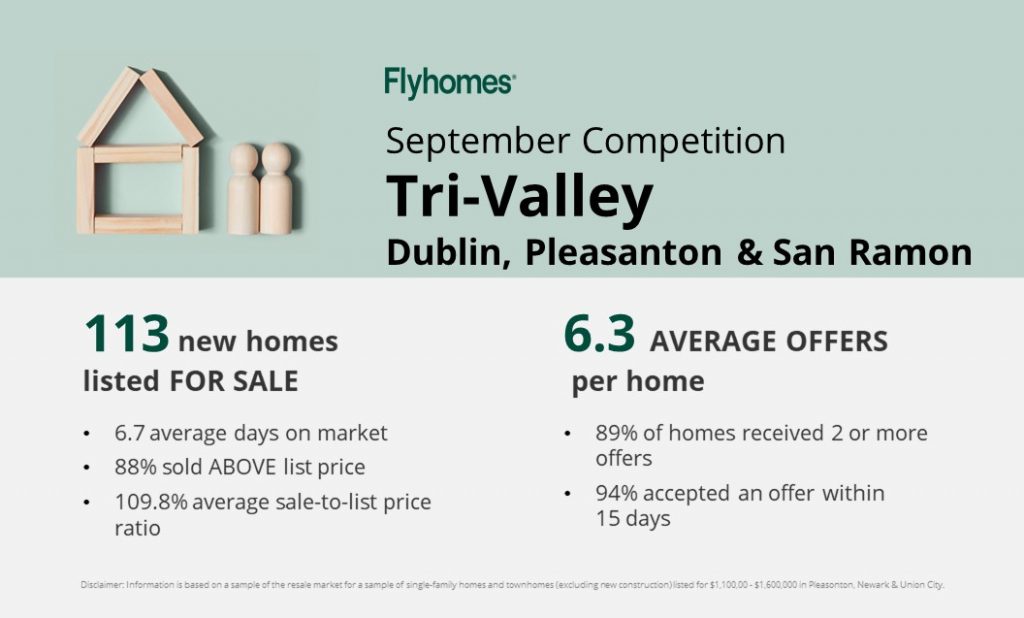
- The Tri-Valley area entered its slow season. Fewer homes were listed for sale and fewer went pending as the median sale price for single family homes dropped 8% from August to its lowest point since pre-peak in April. Homes continue to sell at the same pace while competition decreases, continuing a two-month trend.
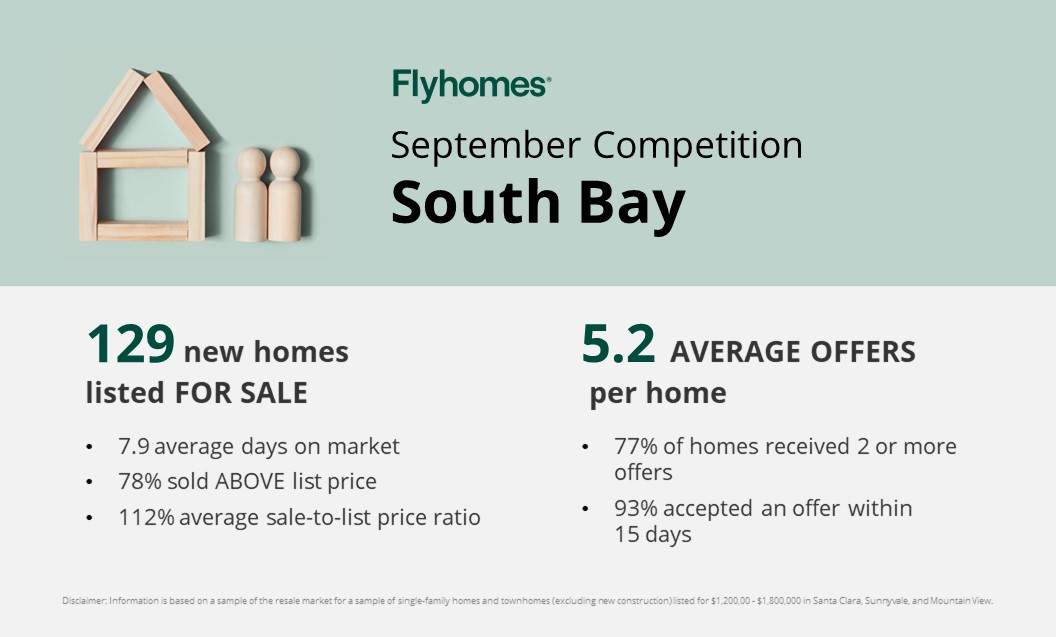
- South Bay sellers are eager. 25% more single family homes and 41% more condos in the South Bay were listed month over month. While the market stayed active with the number of homes going pending increasing by 5% for single family homes and 6% for condos, buyers didn’t keep pace with the big inventory increase and sale-to-list price ratio dropped 1% to the lowest level since February.
- Competition in the Peninsula slowed significantly. Sale-to-list price ratio for single family homes dropped 4% to its lowest number since March. While homes still sold at a quick pace, fewer properties were listed and went pending, and median sale price decreased 1%.
See previous months’ highlights
Competition report
Our research team analyzed the competition in select local areas.

Sale price
List price
Sale price compared to list price
Days on market
Number of properties listed
Number of properties pending sale
San Francisco includes data for the city of San Francisco.
East Bay I includes data for Oakland and Berkeley.
East Bay II includes data for Fremont, Newark, and Union City.
Tri-Valley includes data for Dublin, Pleasanton, and San Ramon.
South Bay includes data for San Jose, Santa Clara, and Sunnyvale.
Peninsula includes data for San Mateo, Foster City, Belmont, and San Carlos.