


Key takeaways for the month
The Bay Area market continues to be less competitive than in usual years, with the East Bay and the South Bay, to a lesser extent, as exceptions.
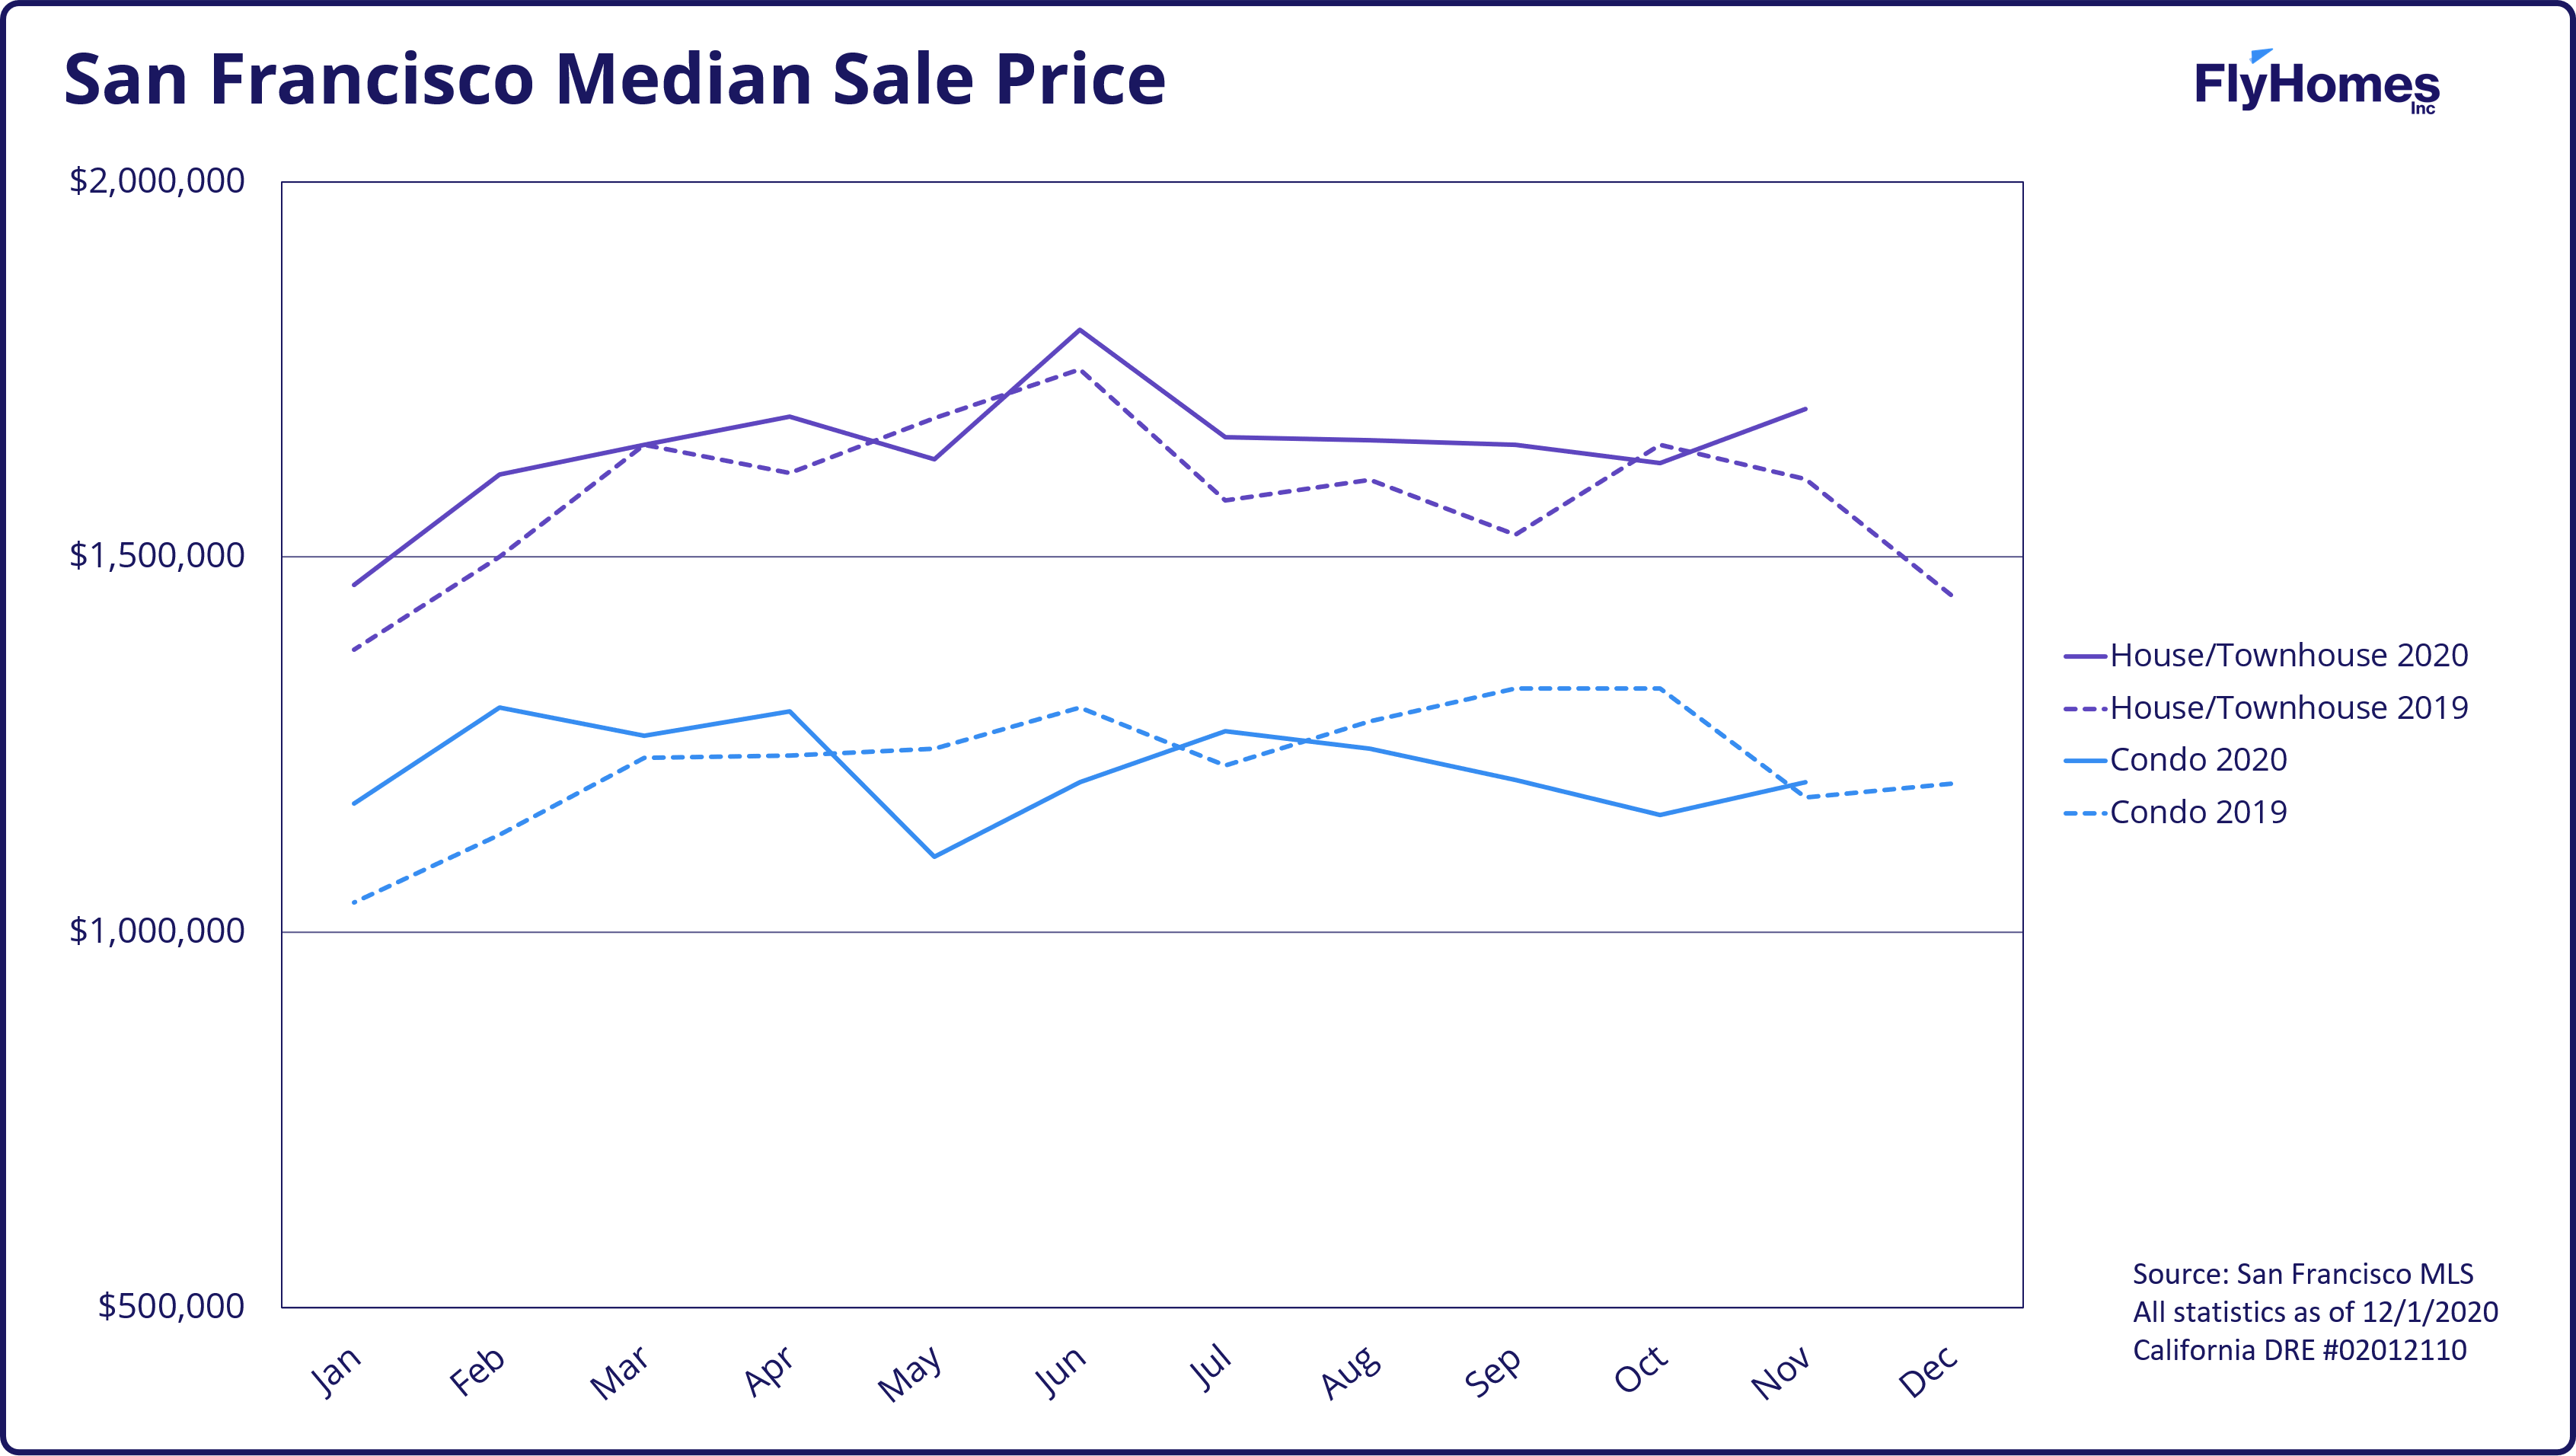
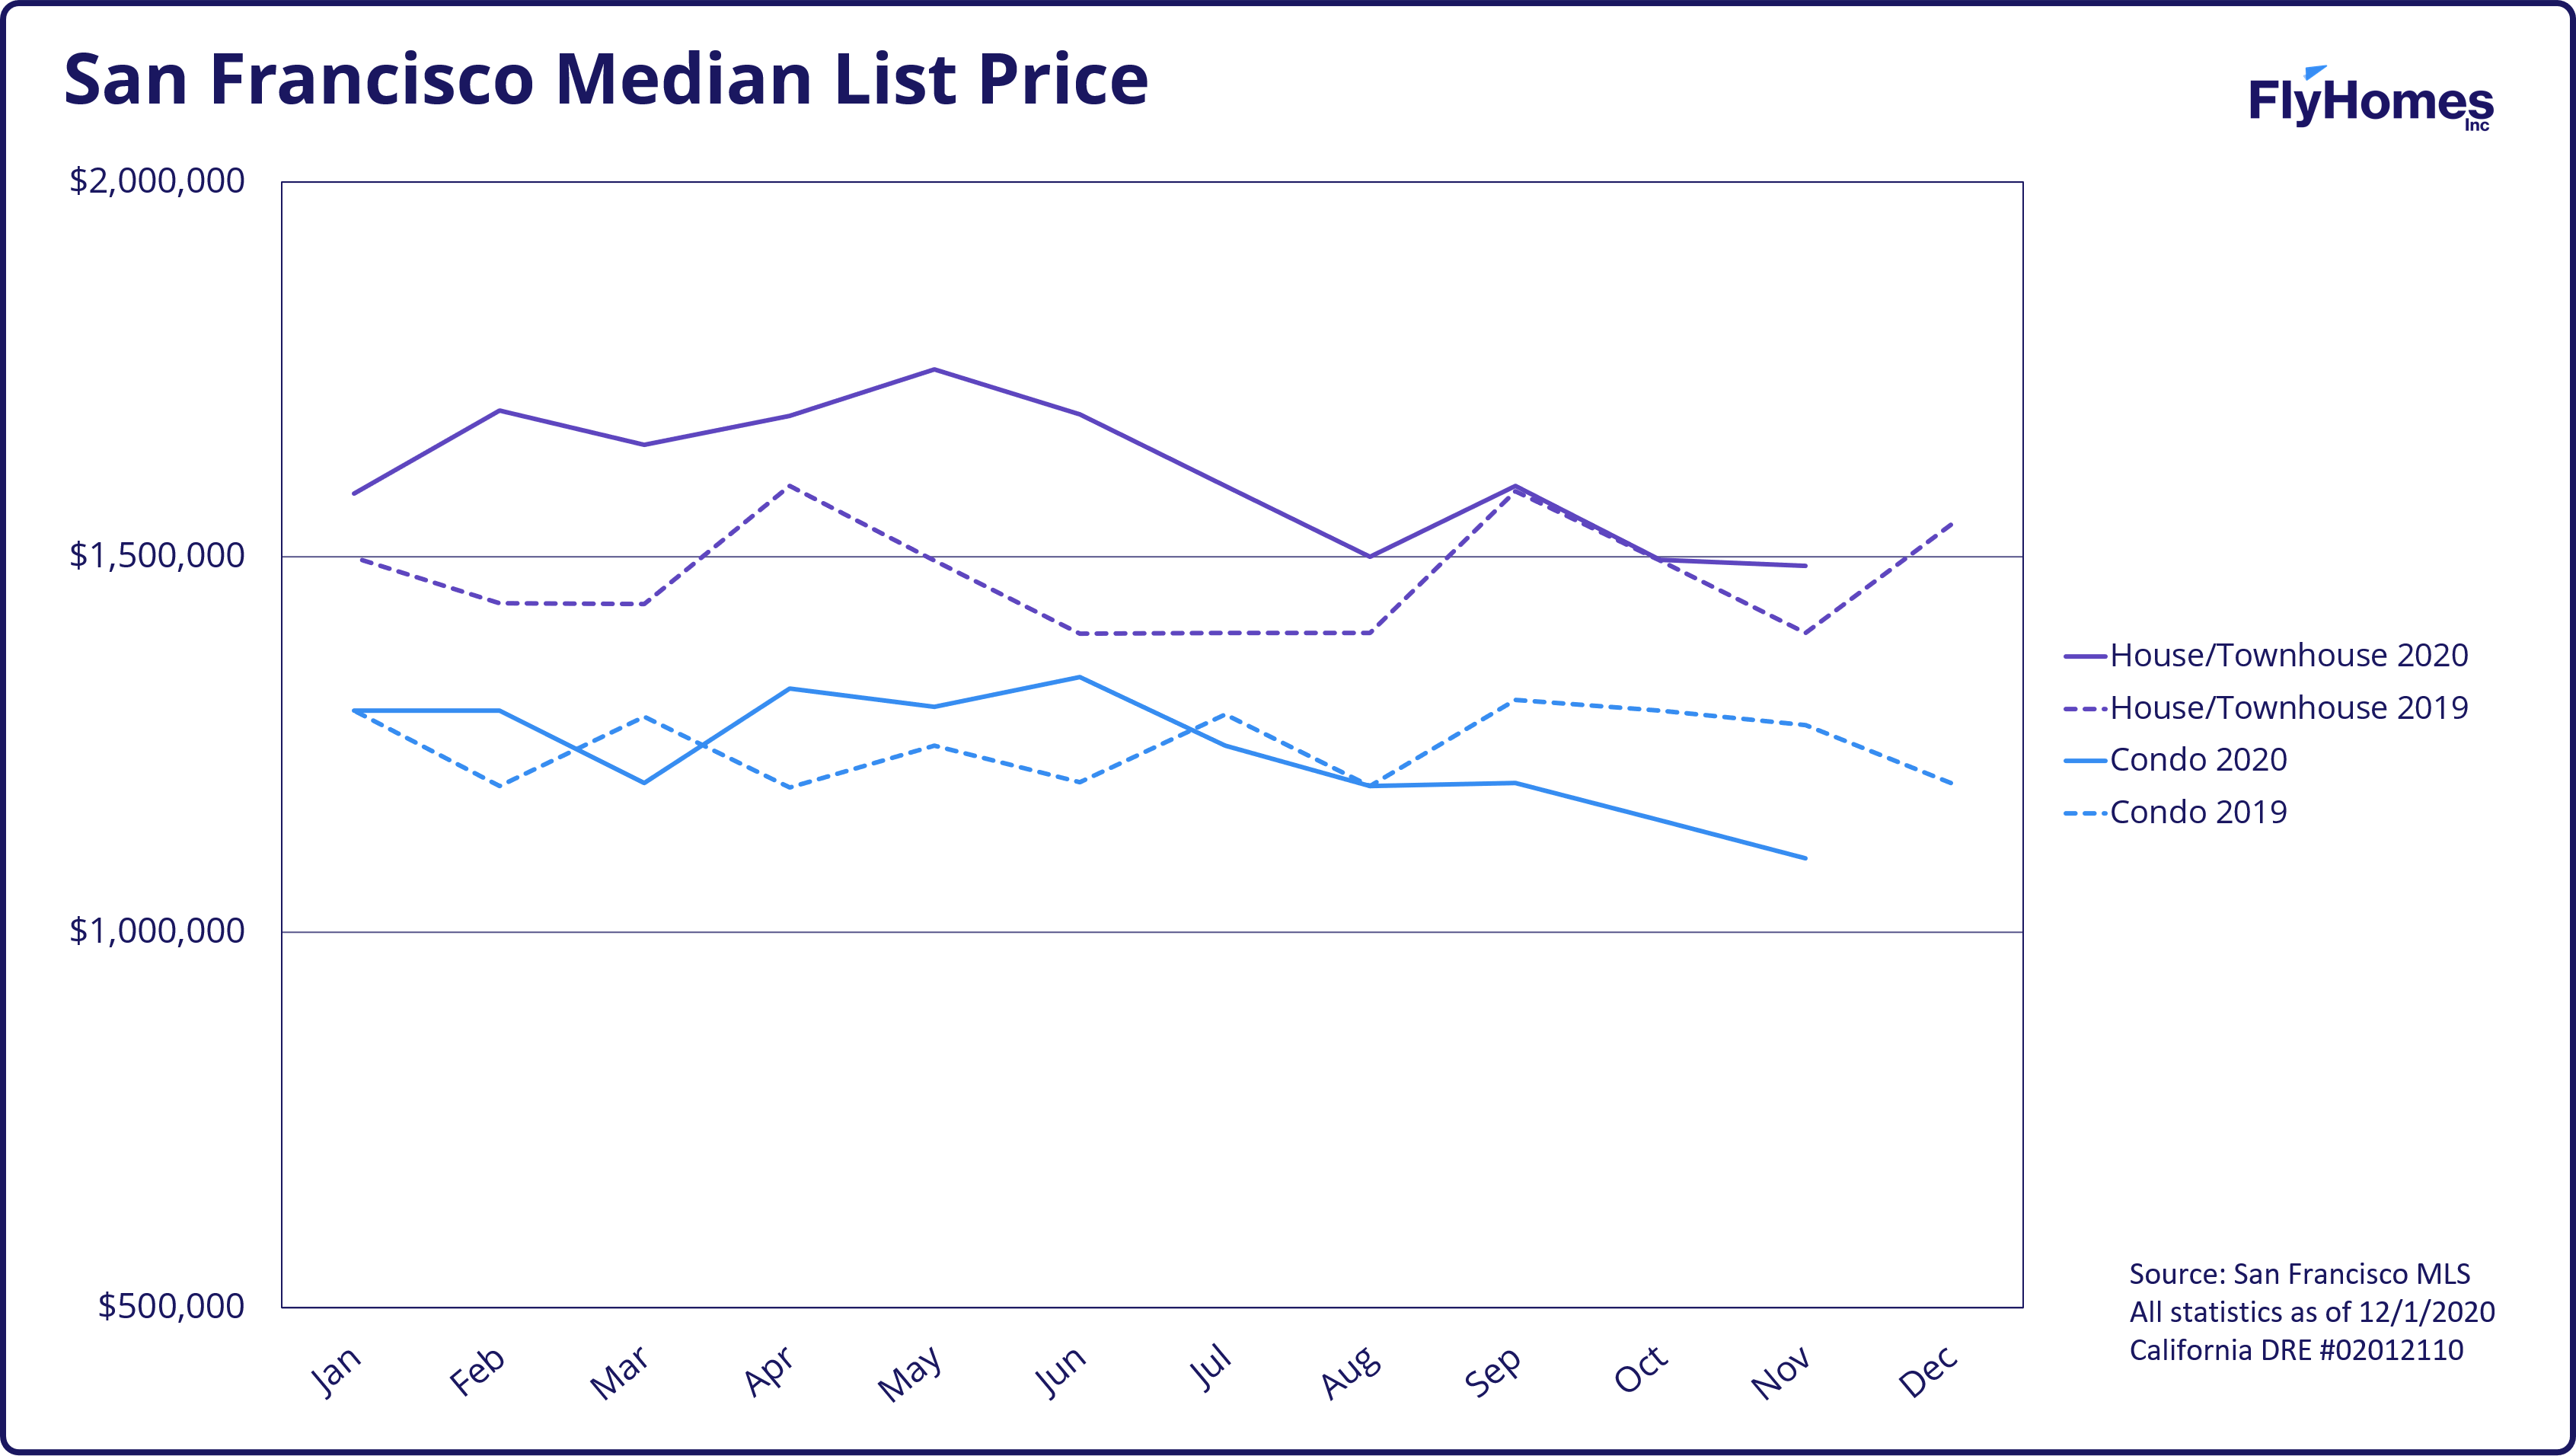
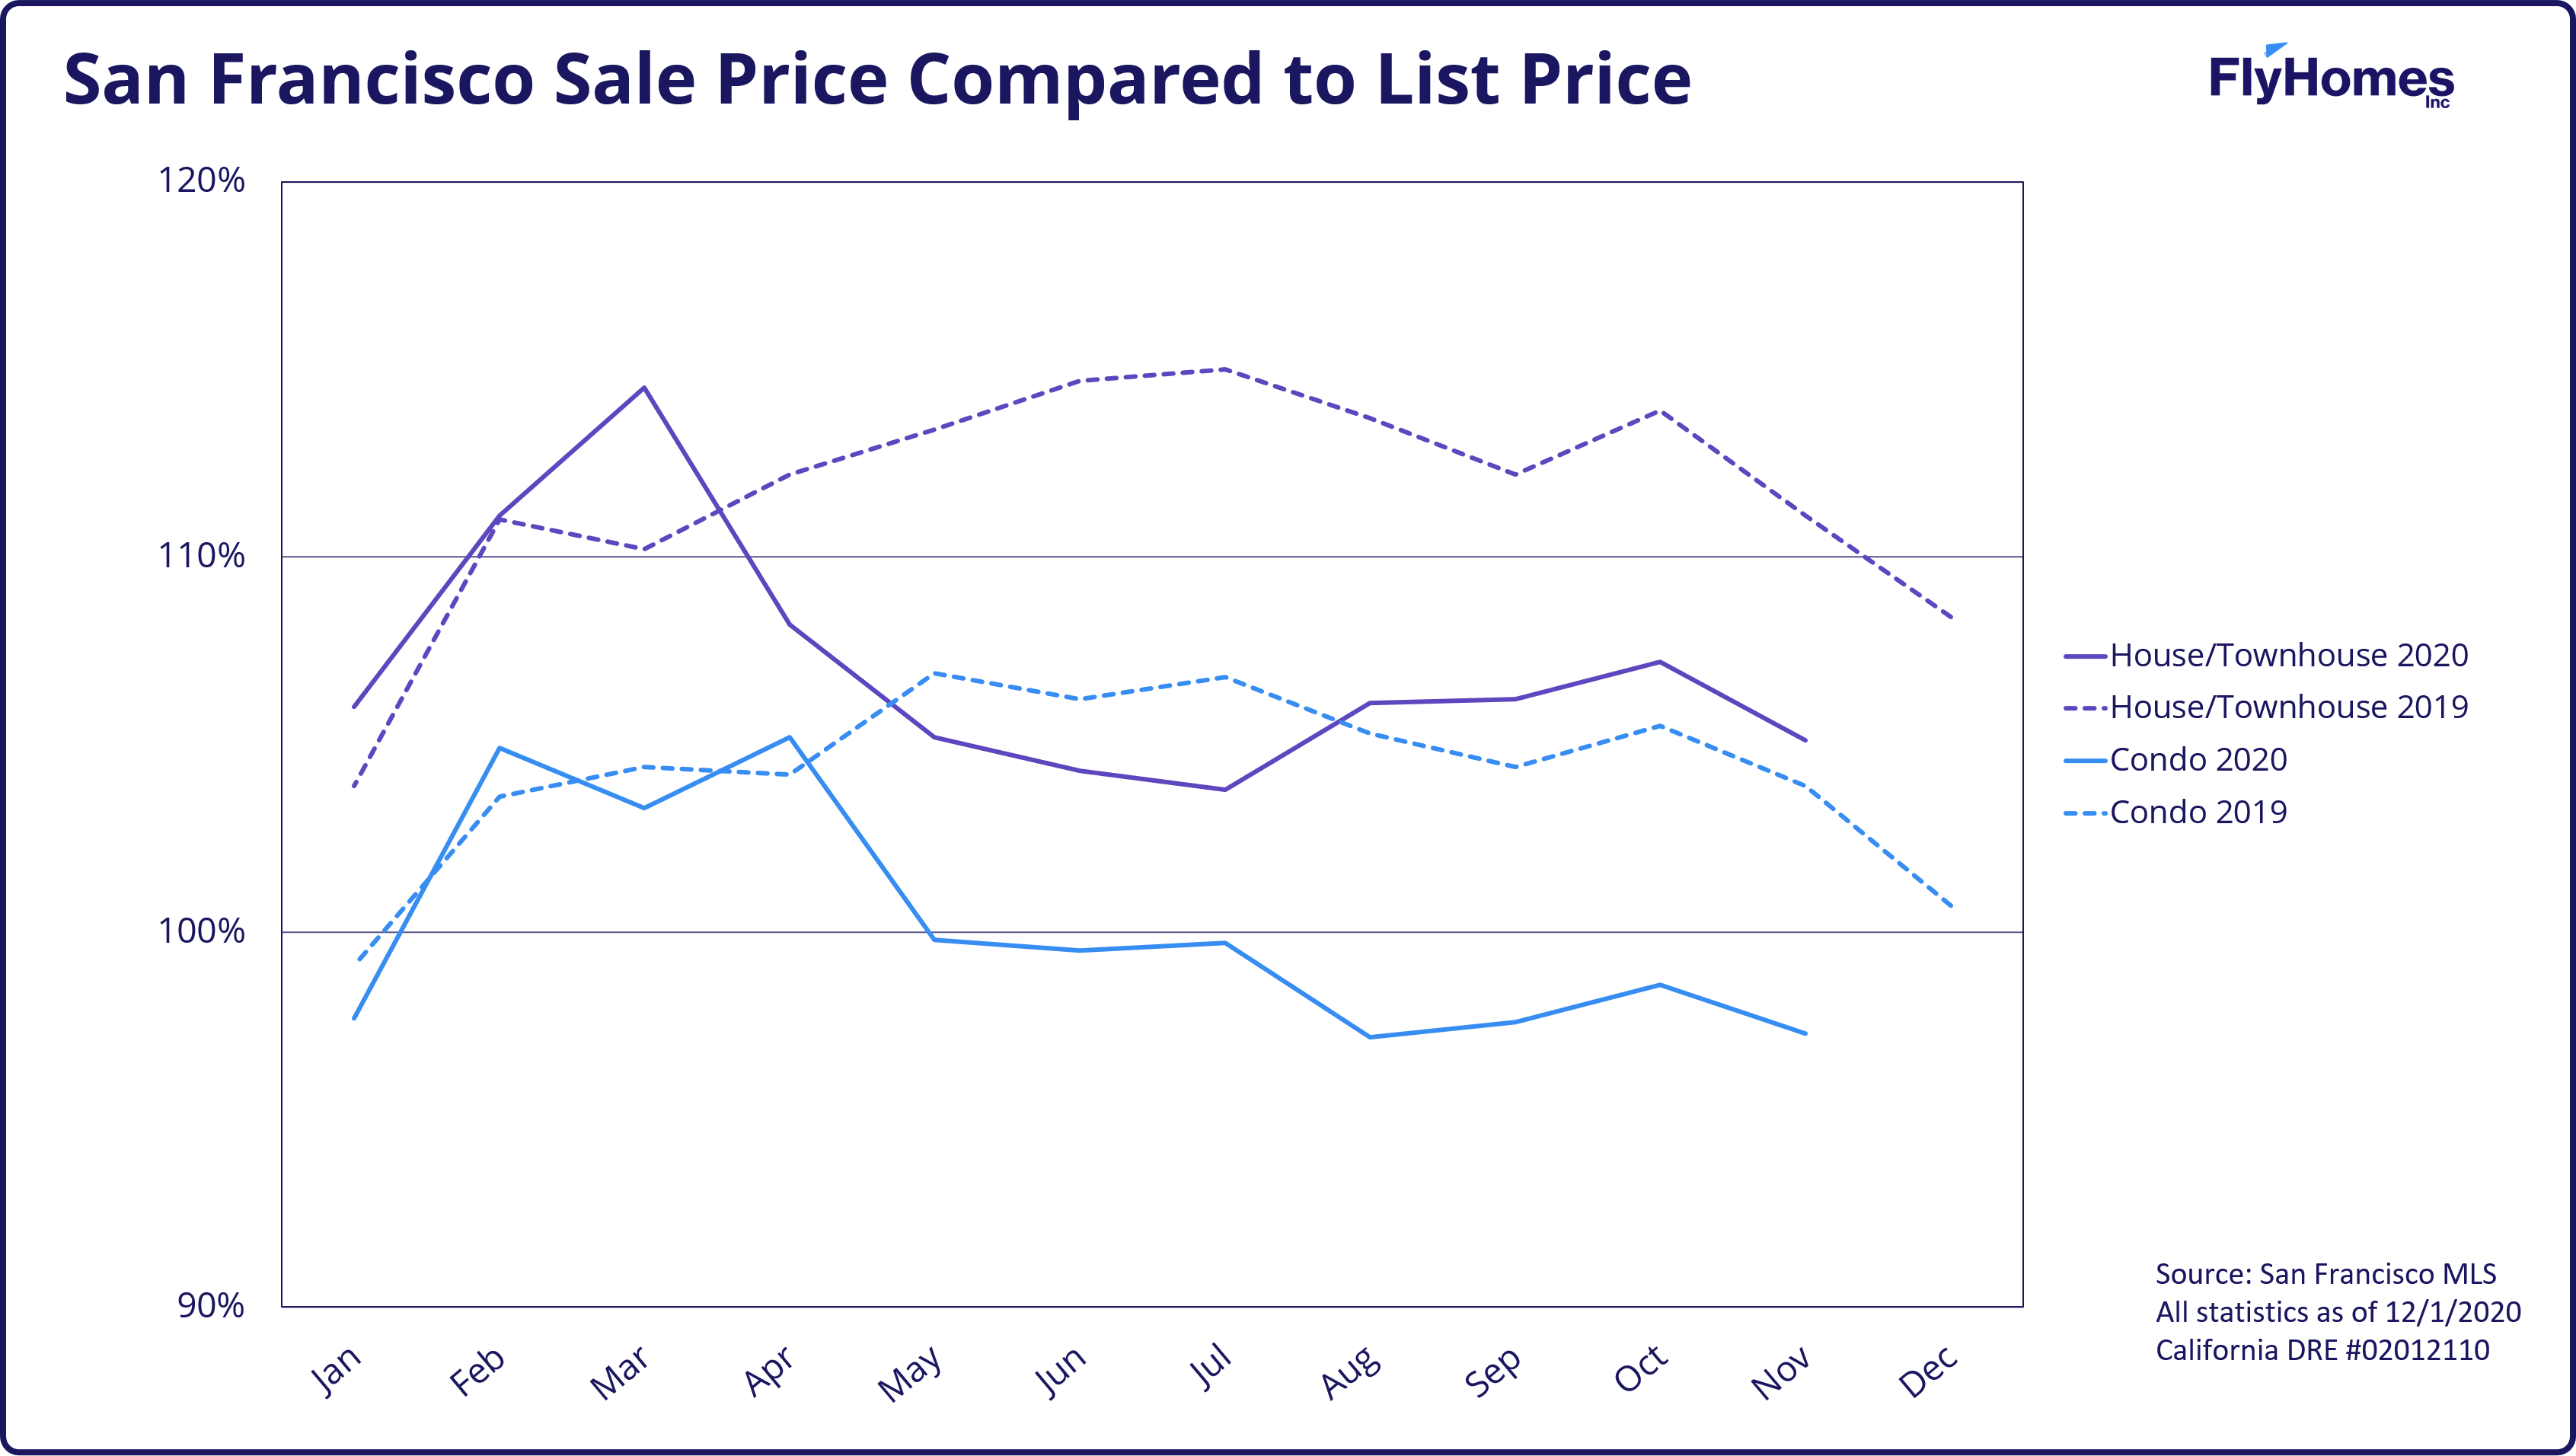
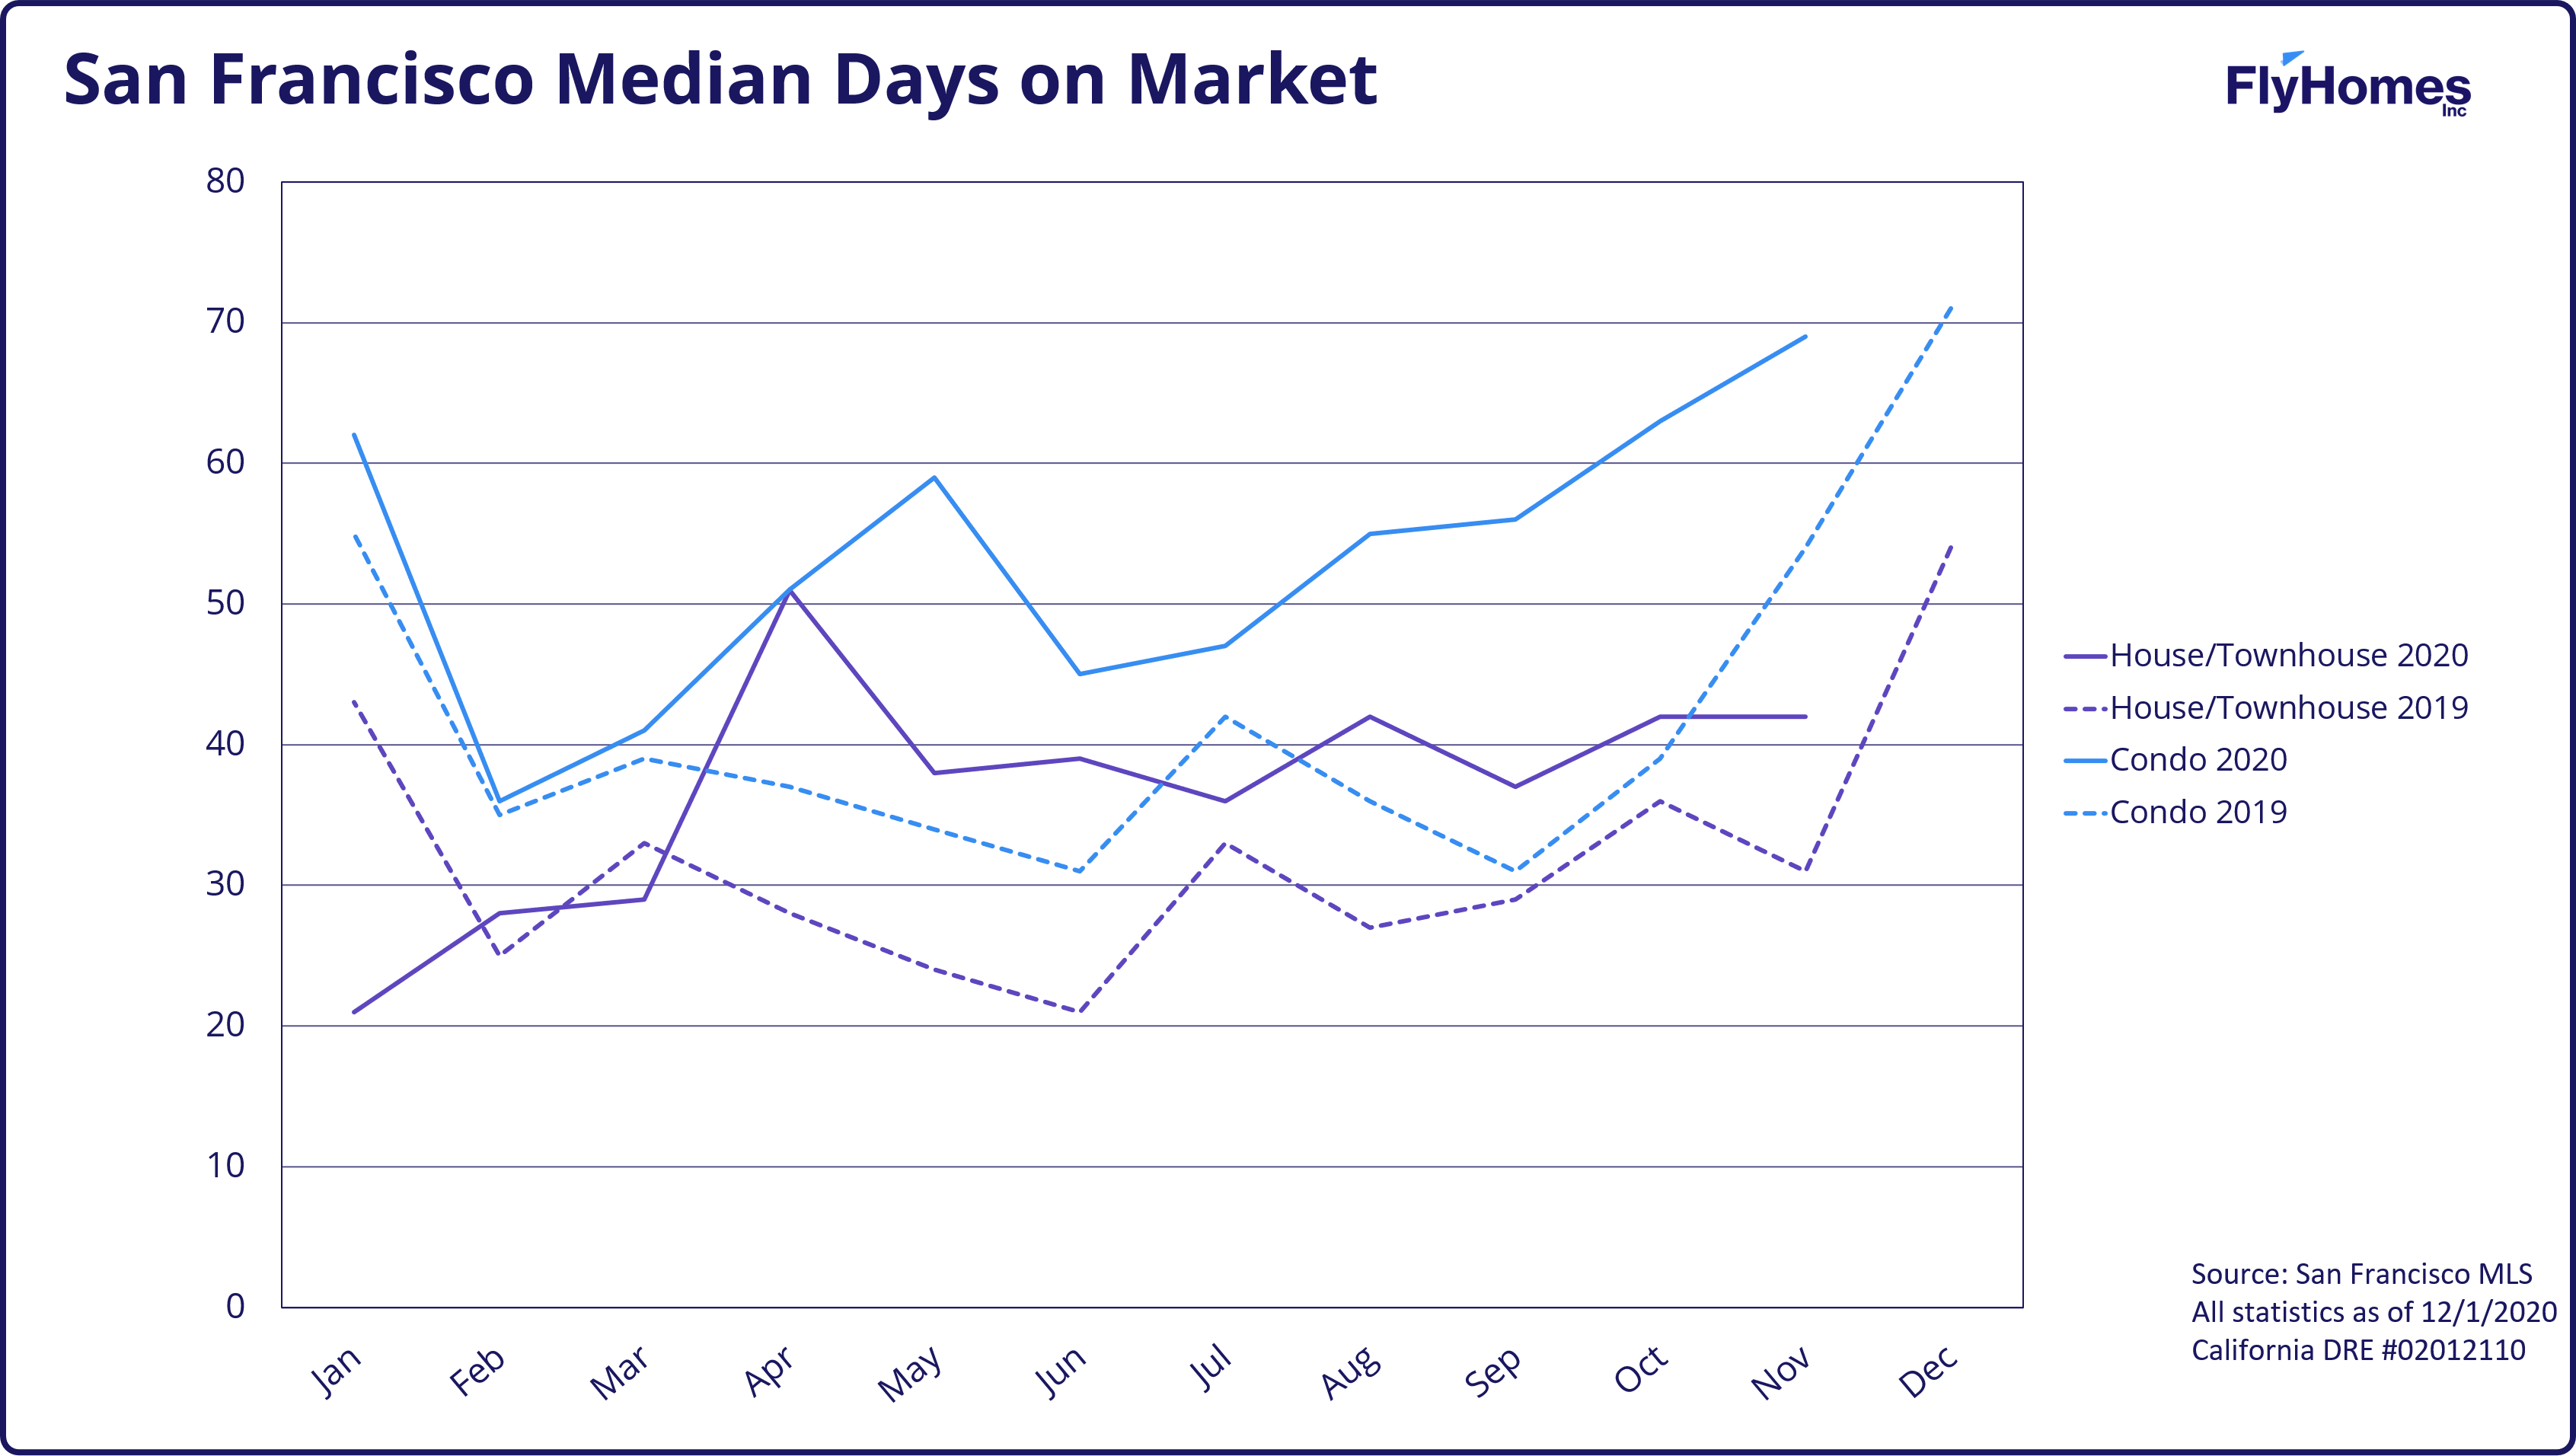
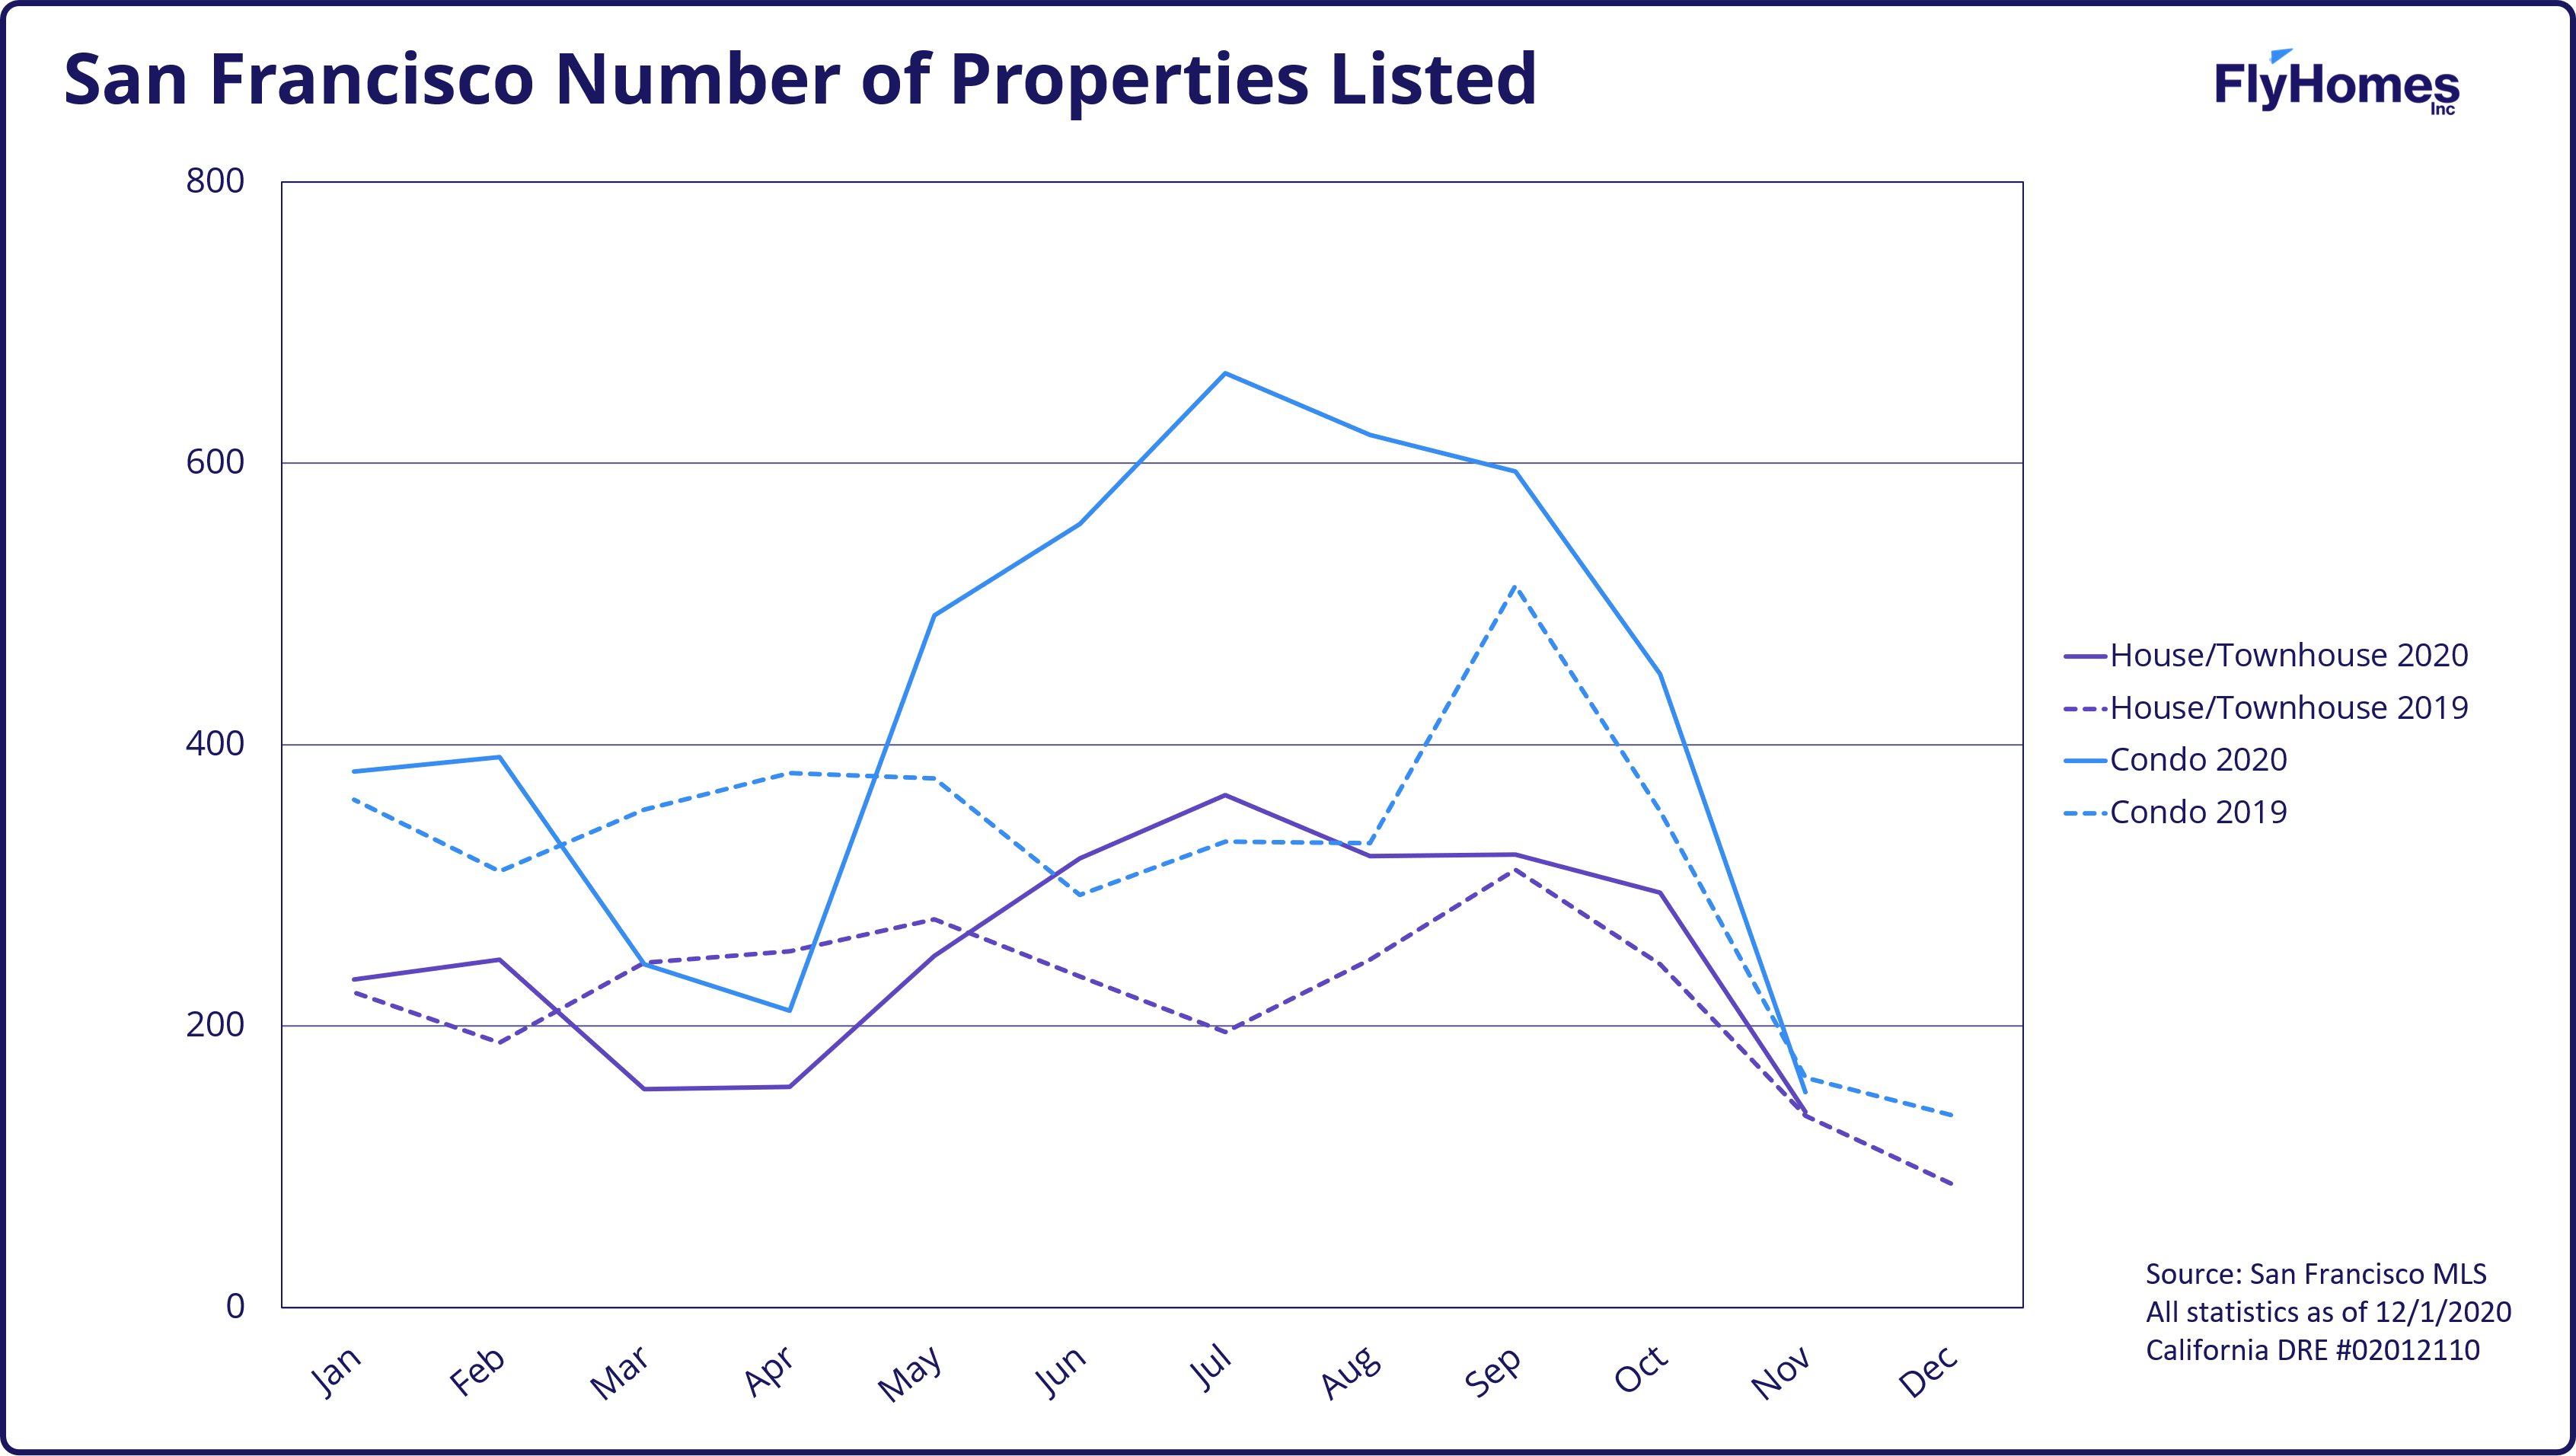
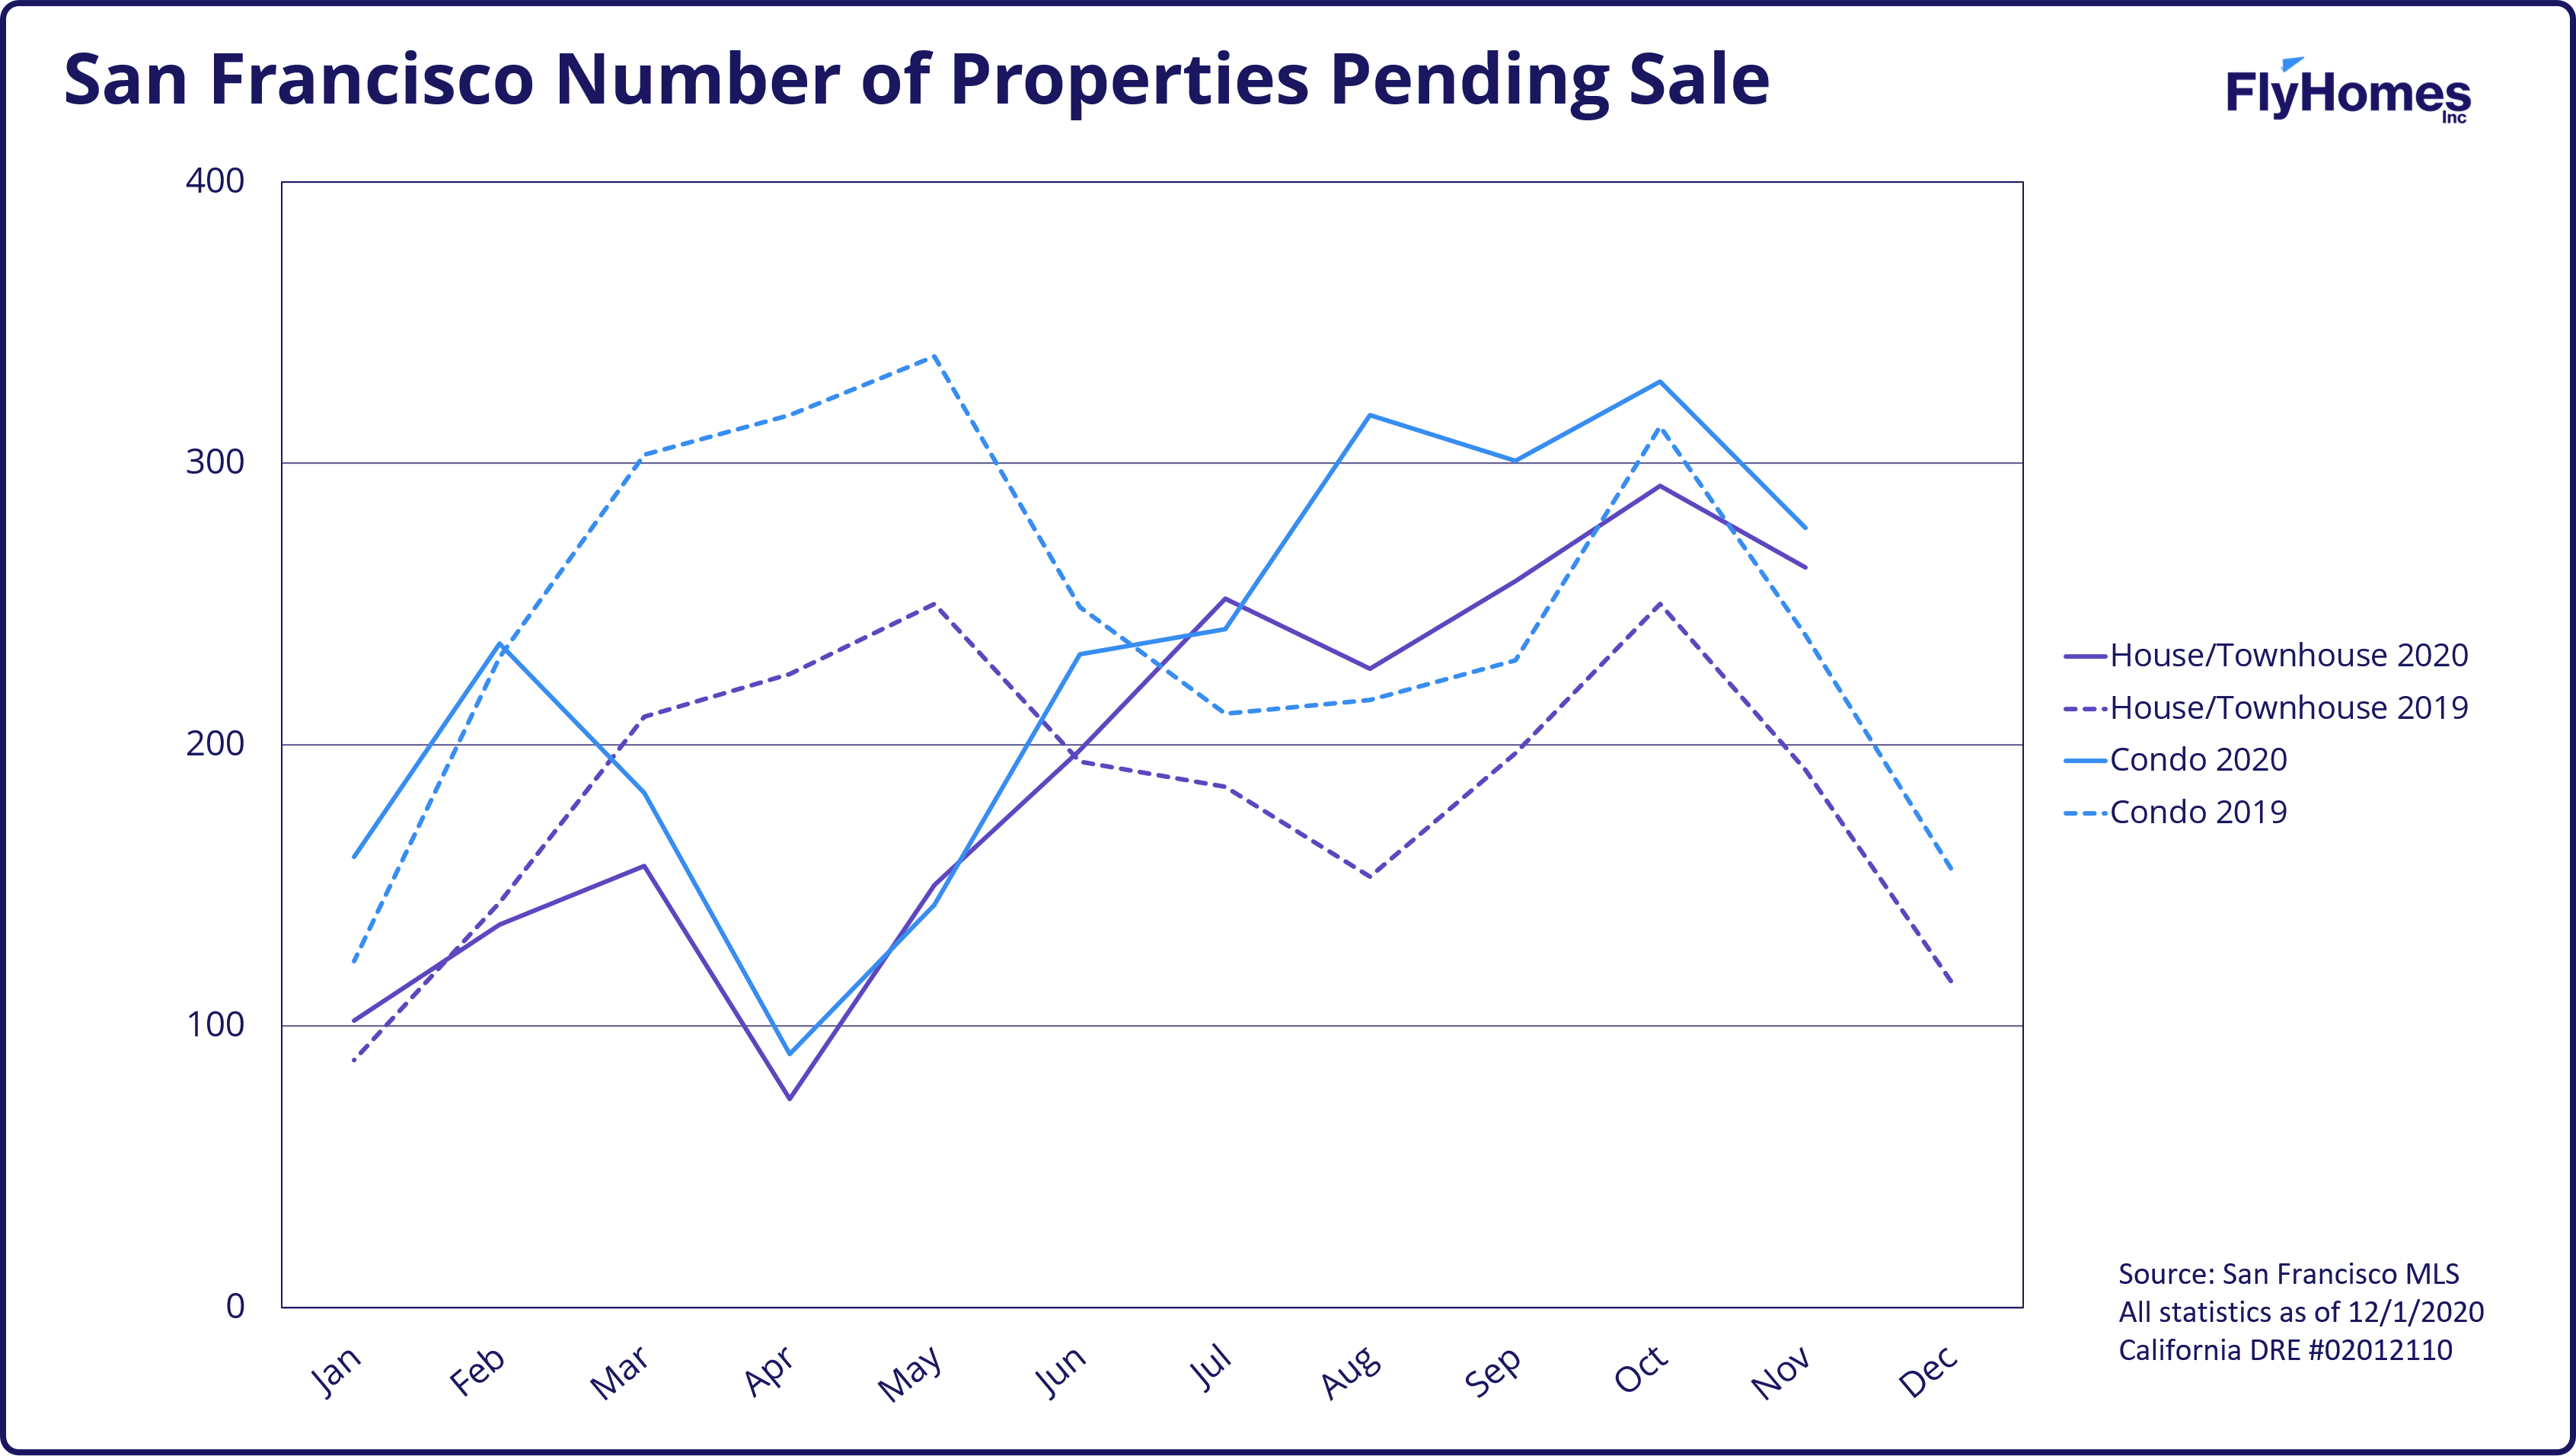
- The summer’s exceptional number of San Francisco condo listings has normalized. Extra inventory remains on the market, indicated by higher-than-usual days on market that are up month over month, but new listings fell below last November’s count. Sale-to-list price ratio is down, indicating that buyers are getting good deals on the condos that have been sitting on the market.
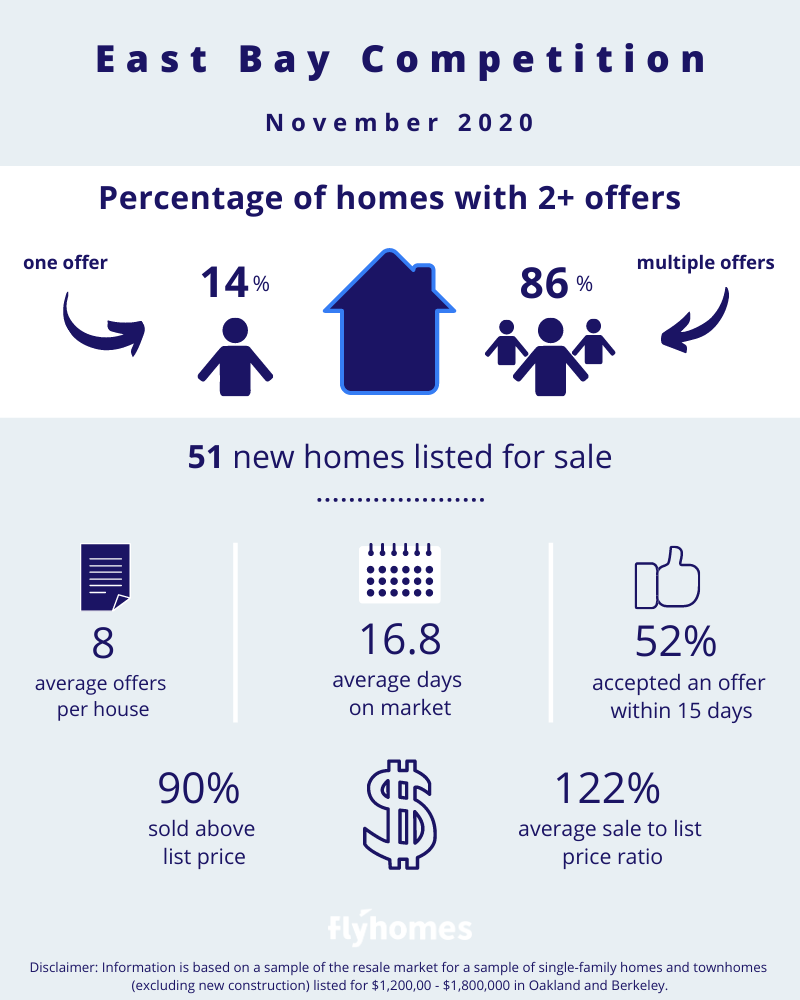
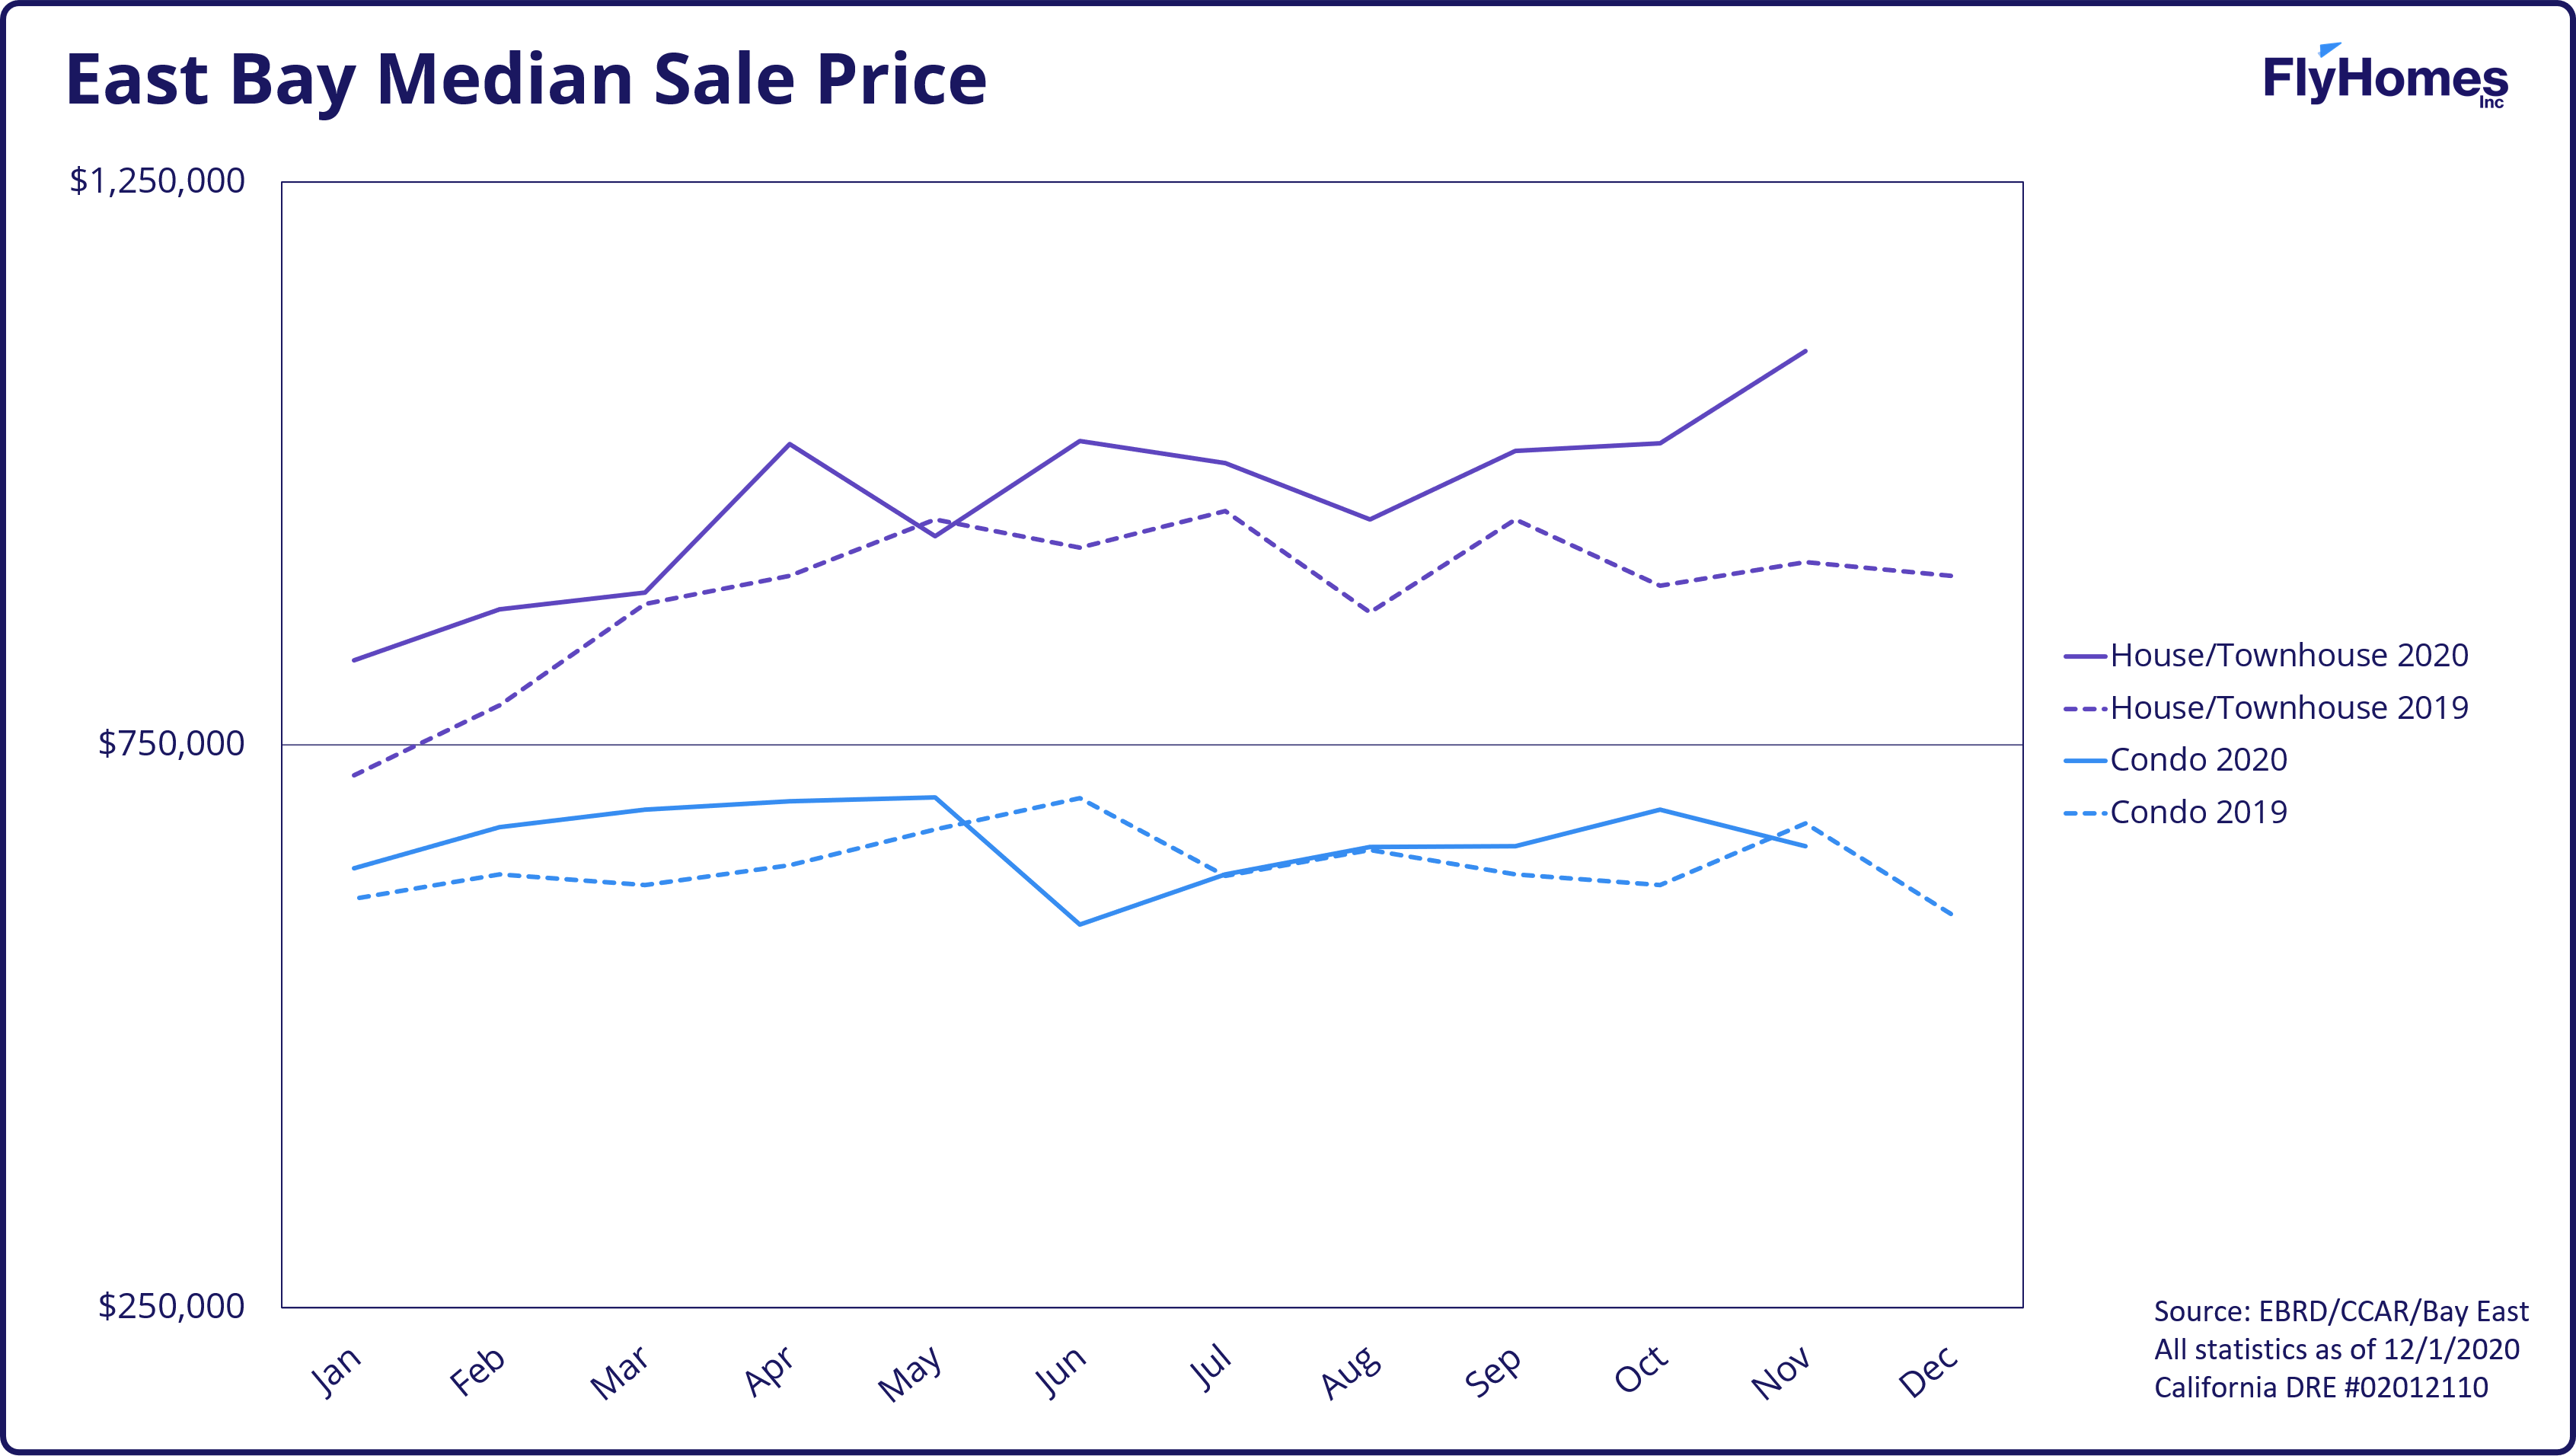
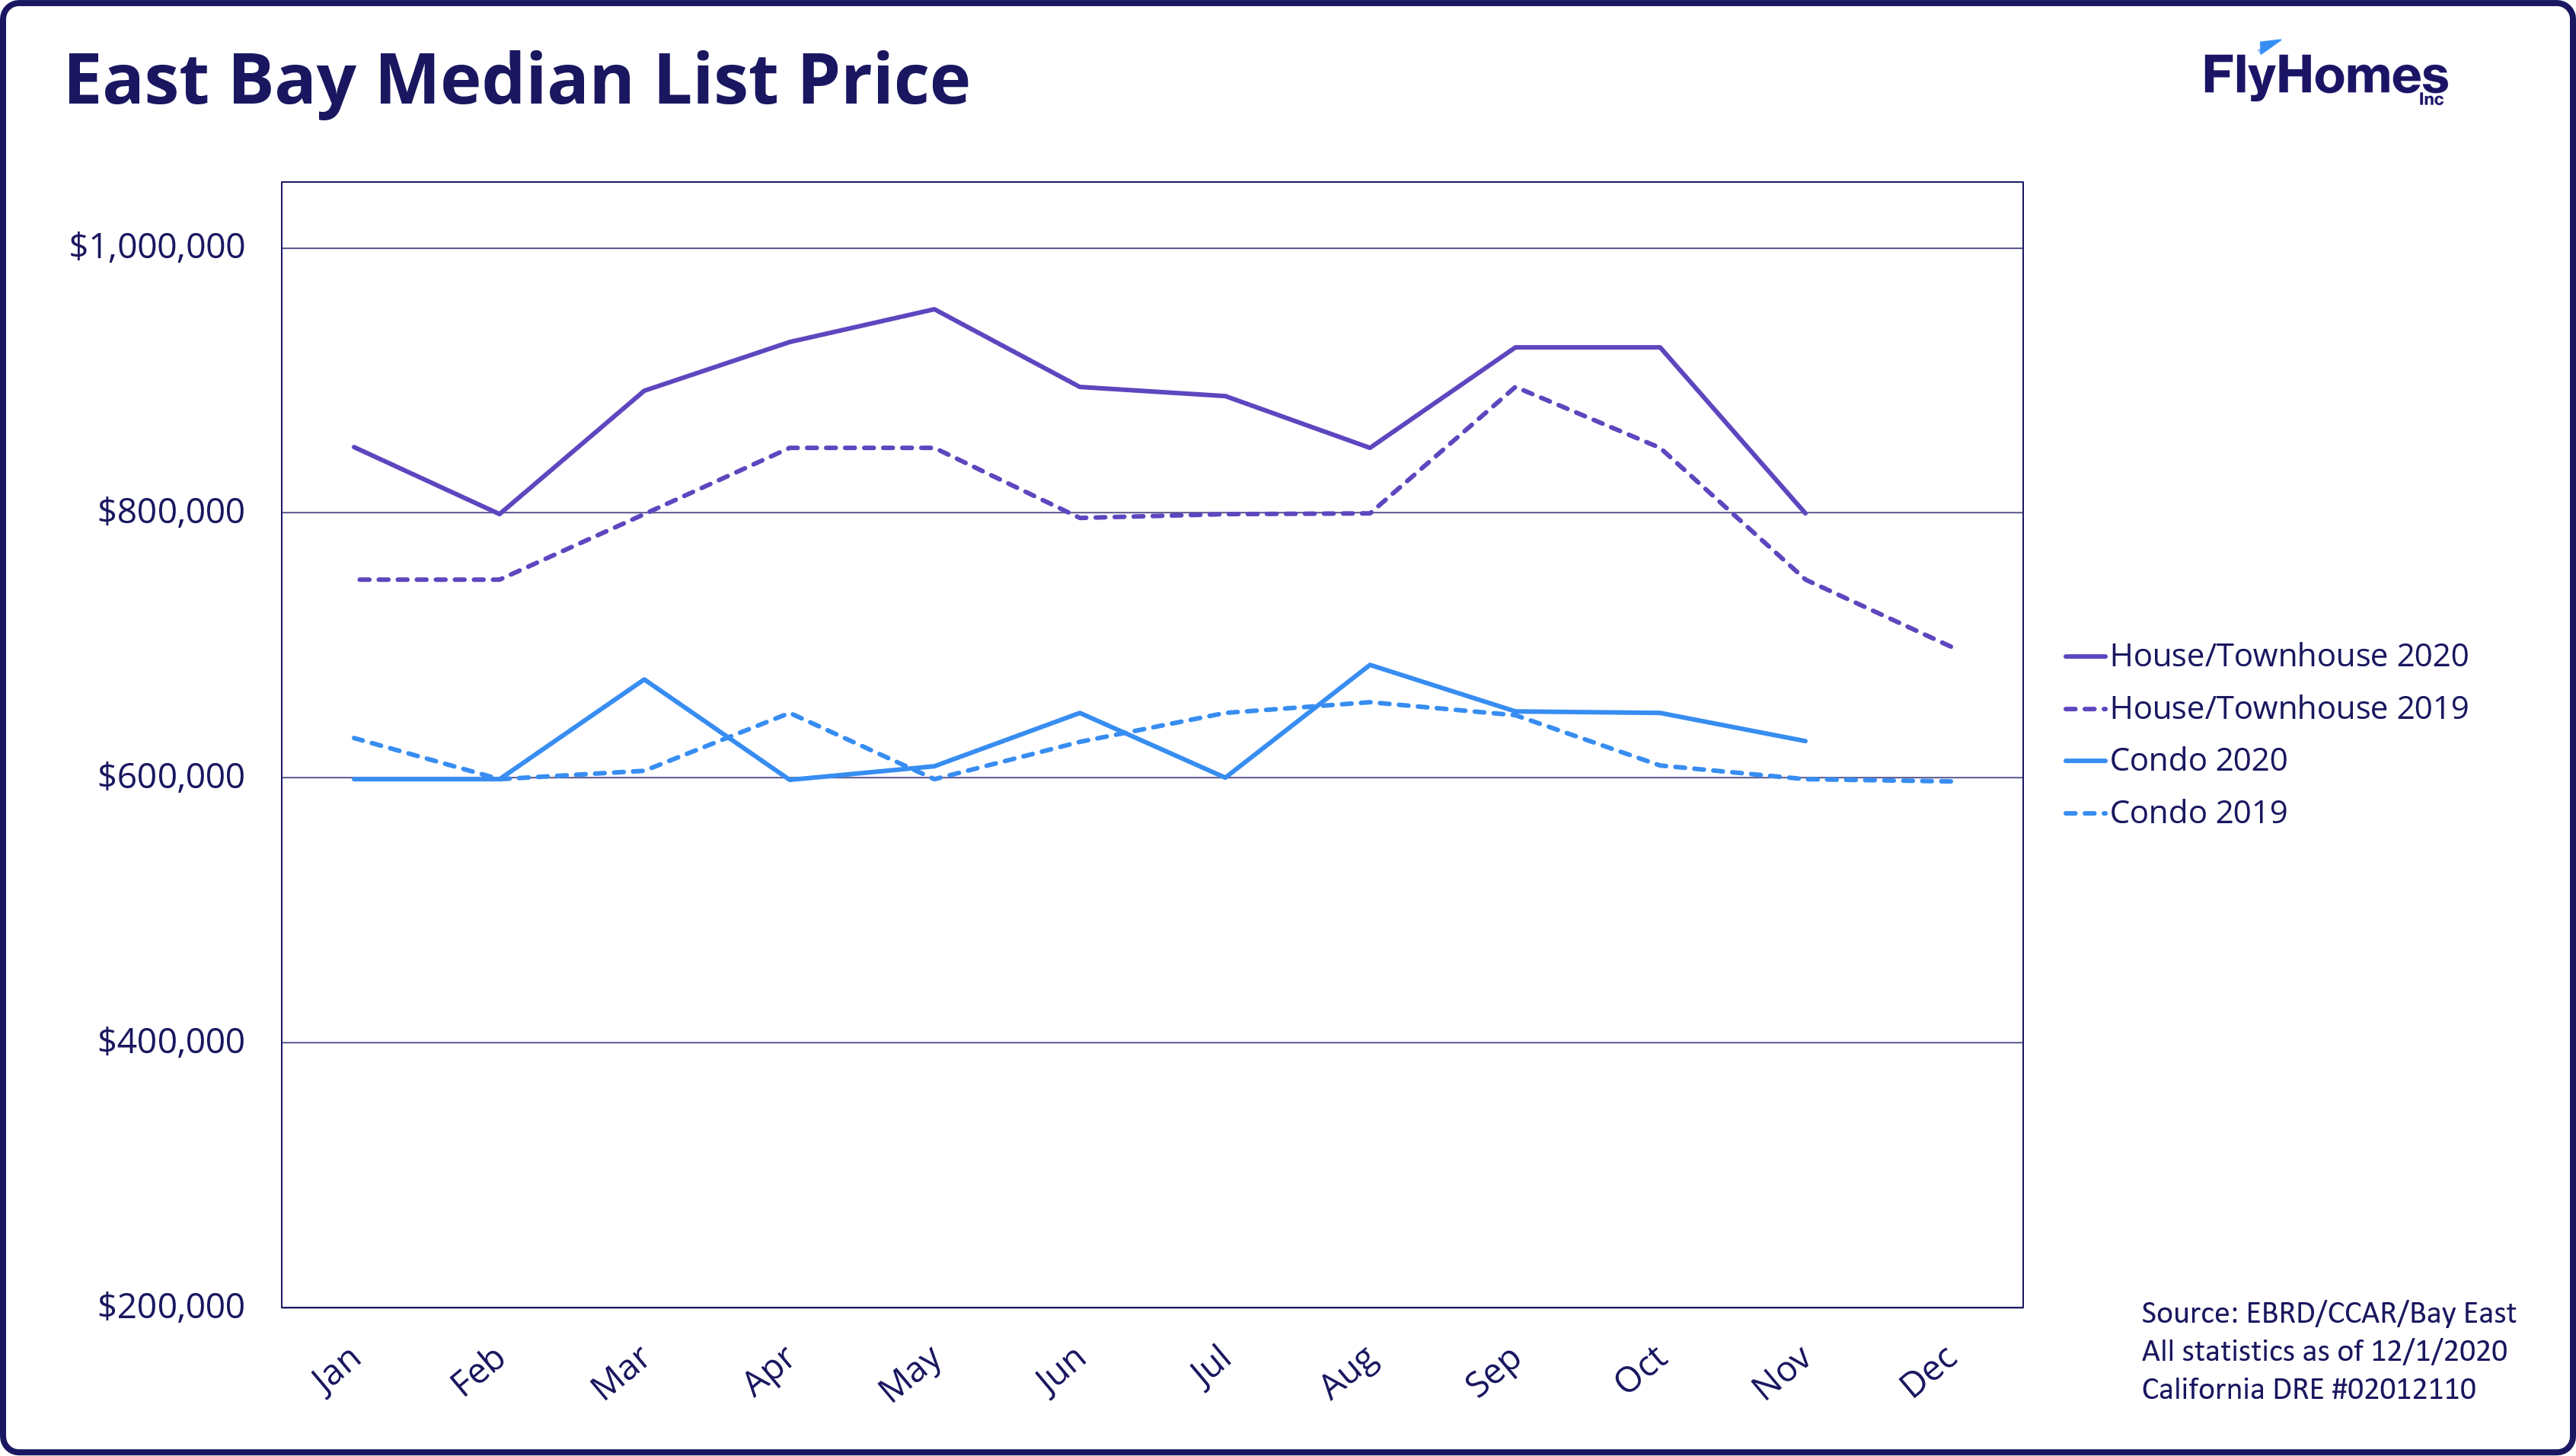
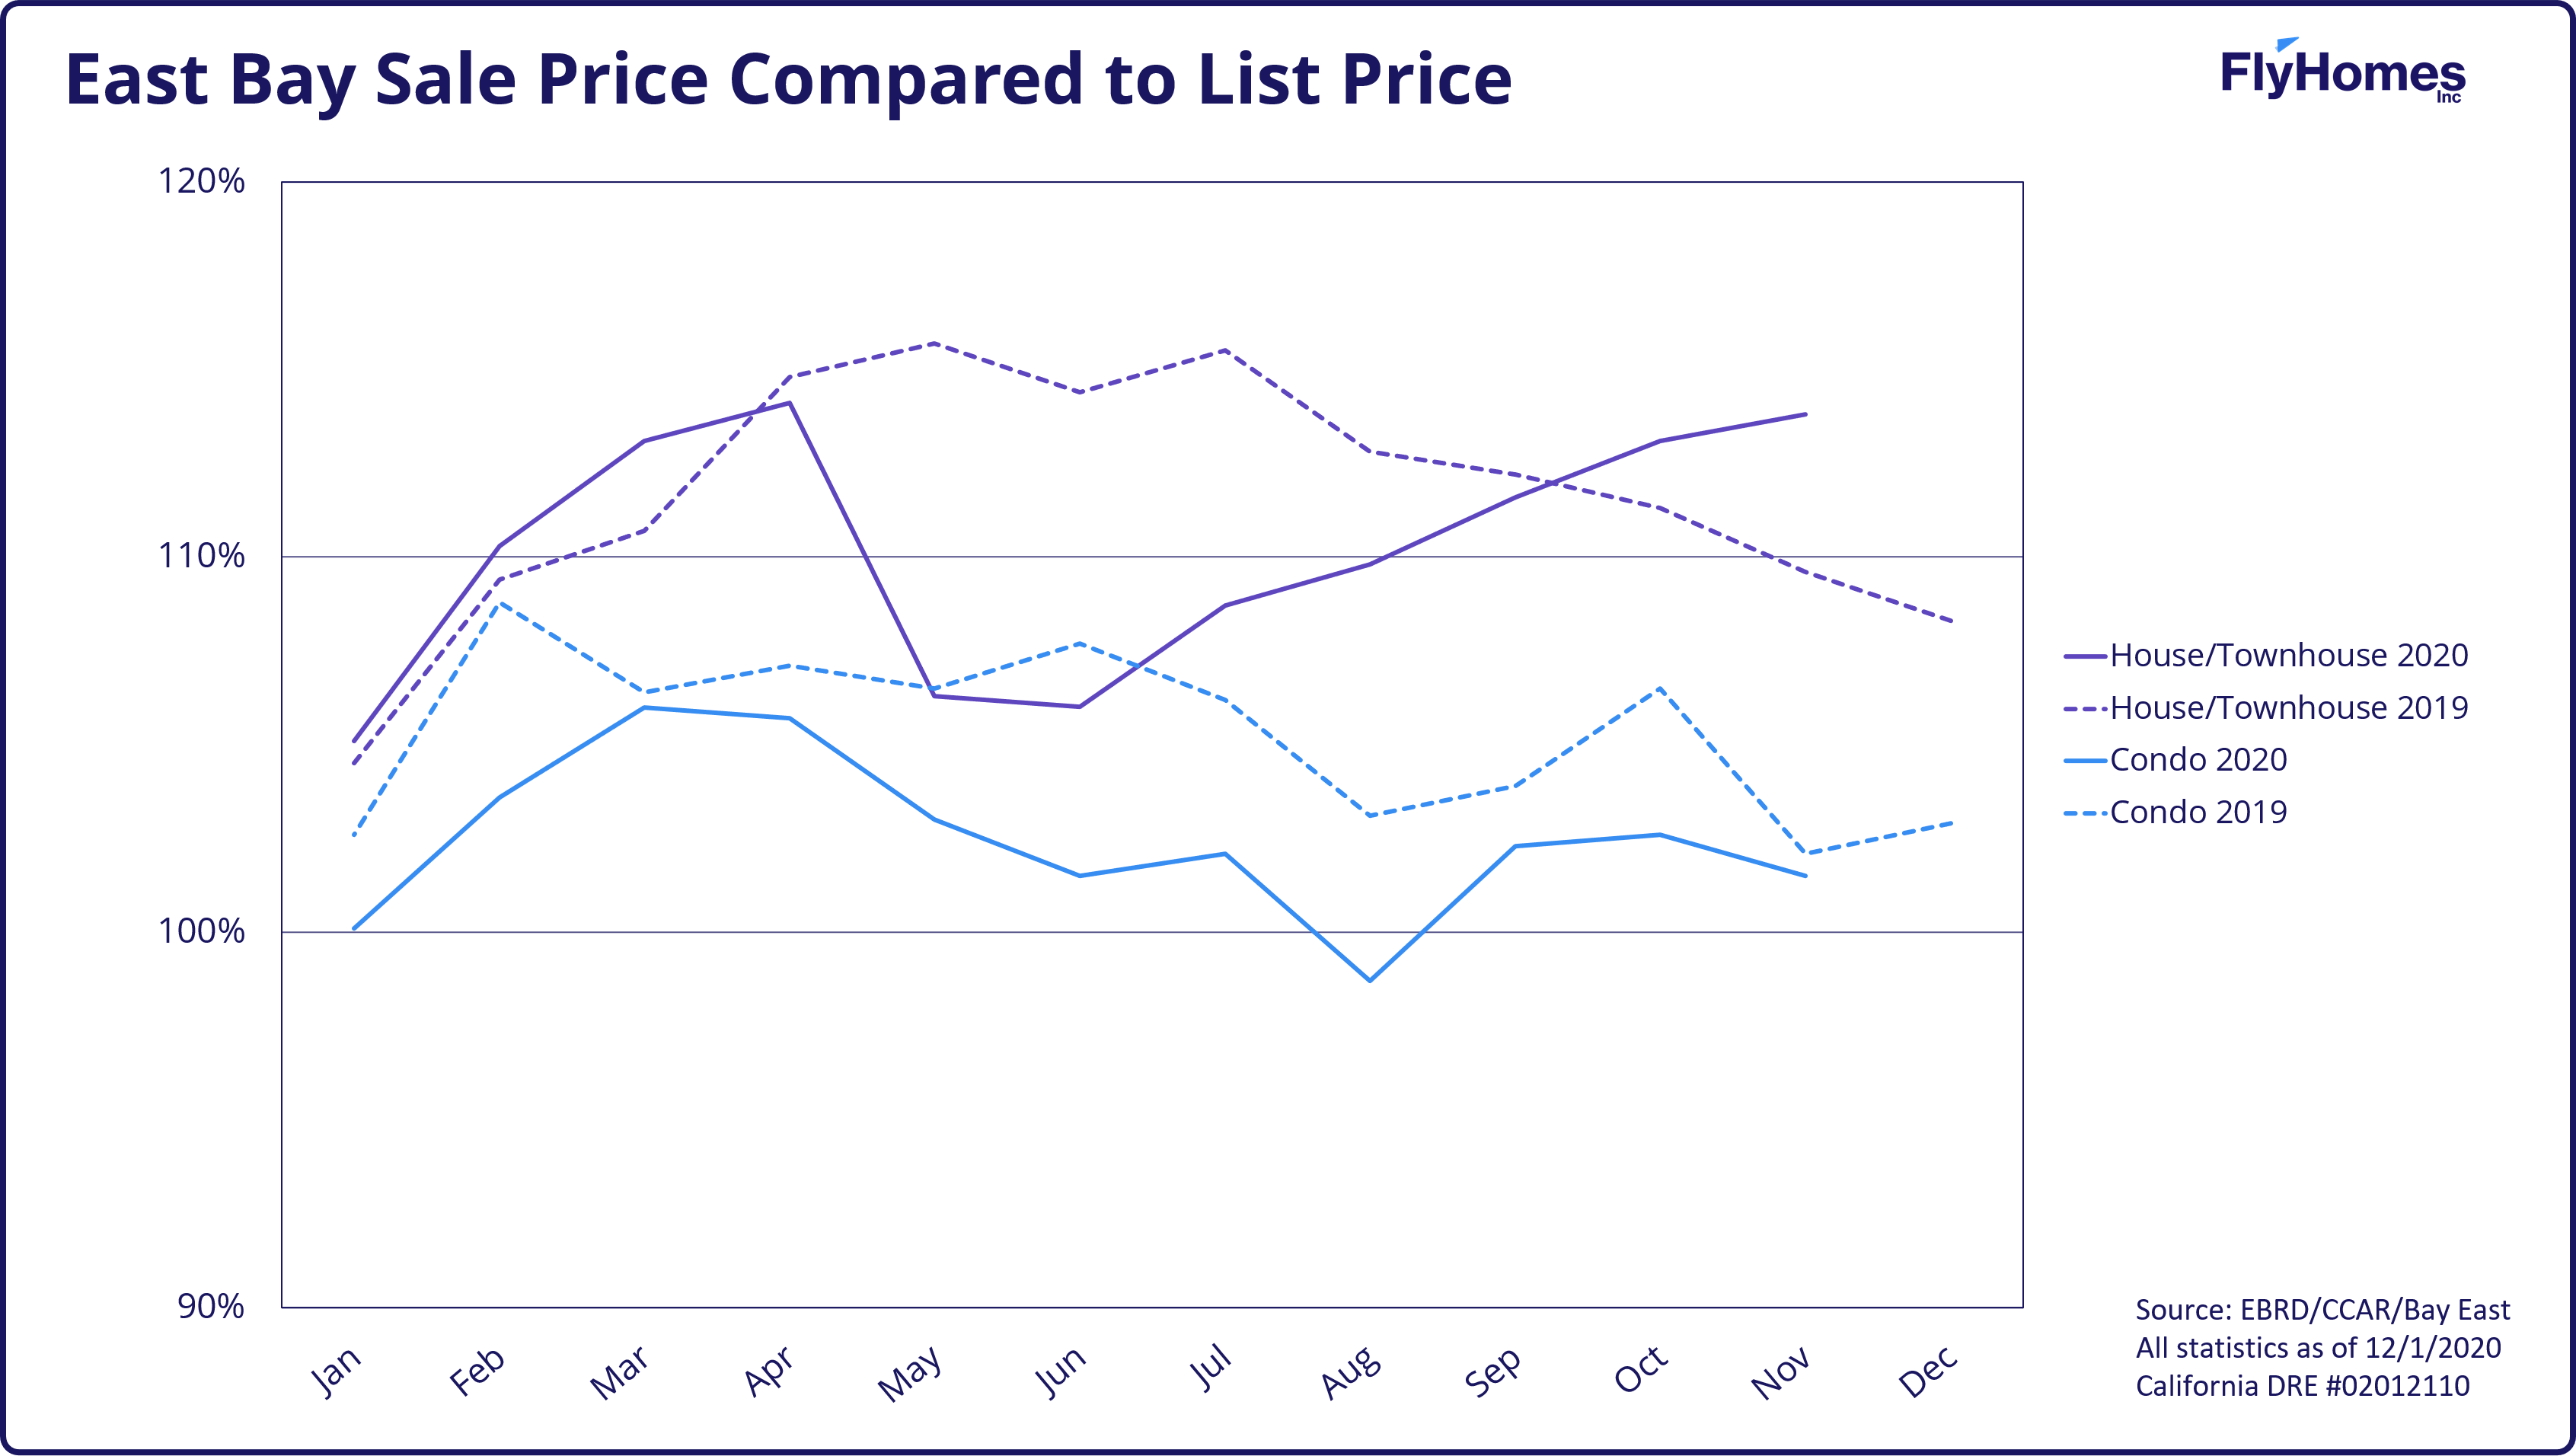
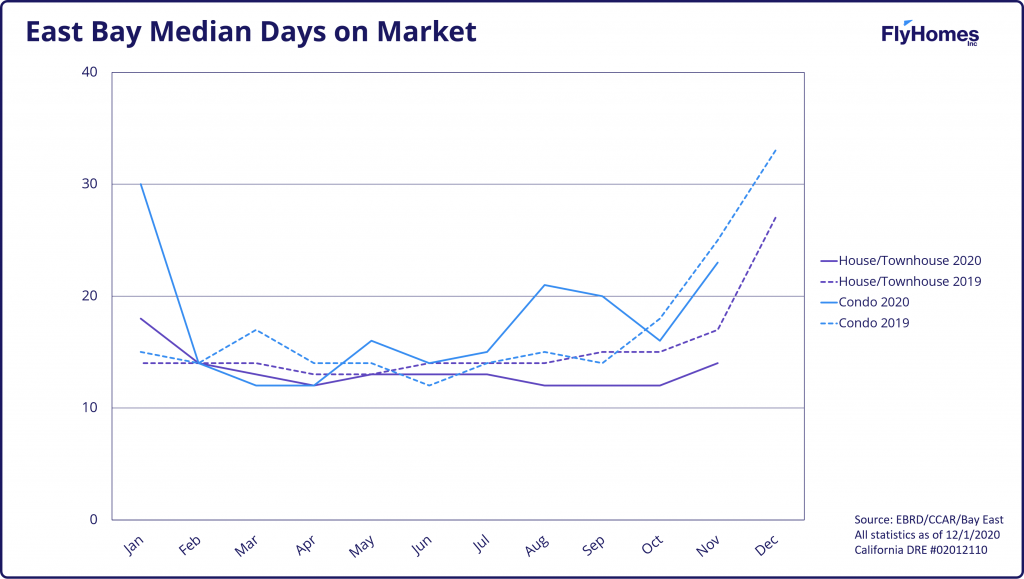
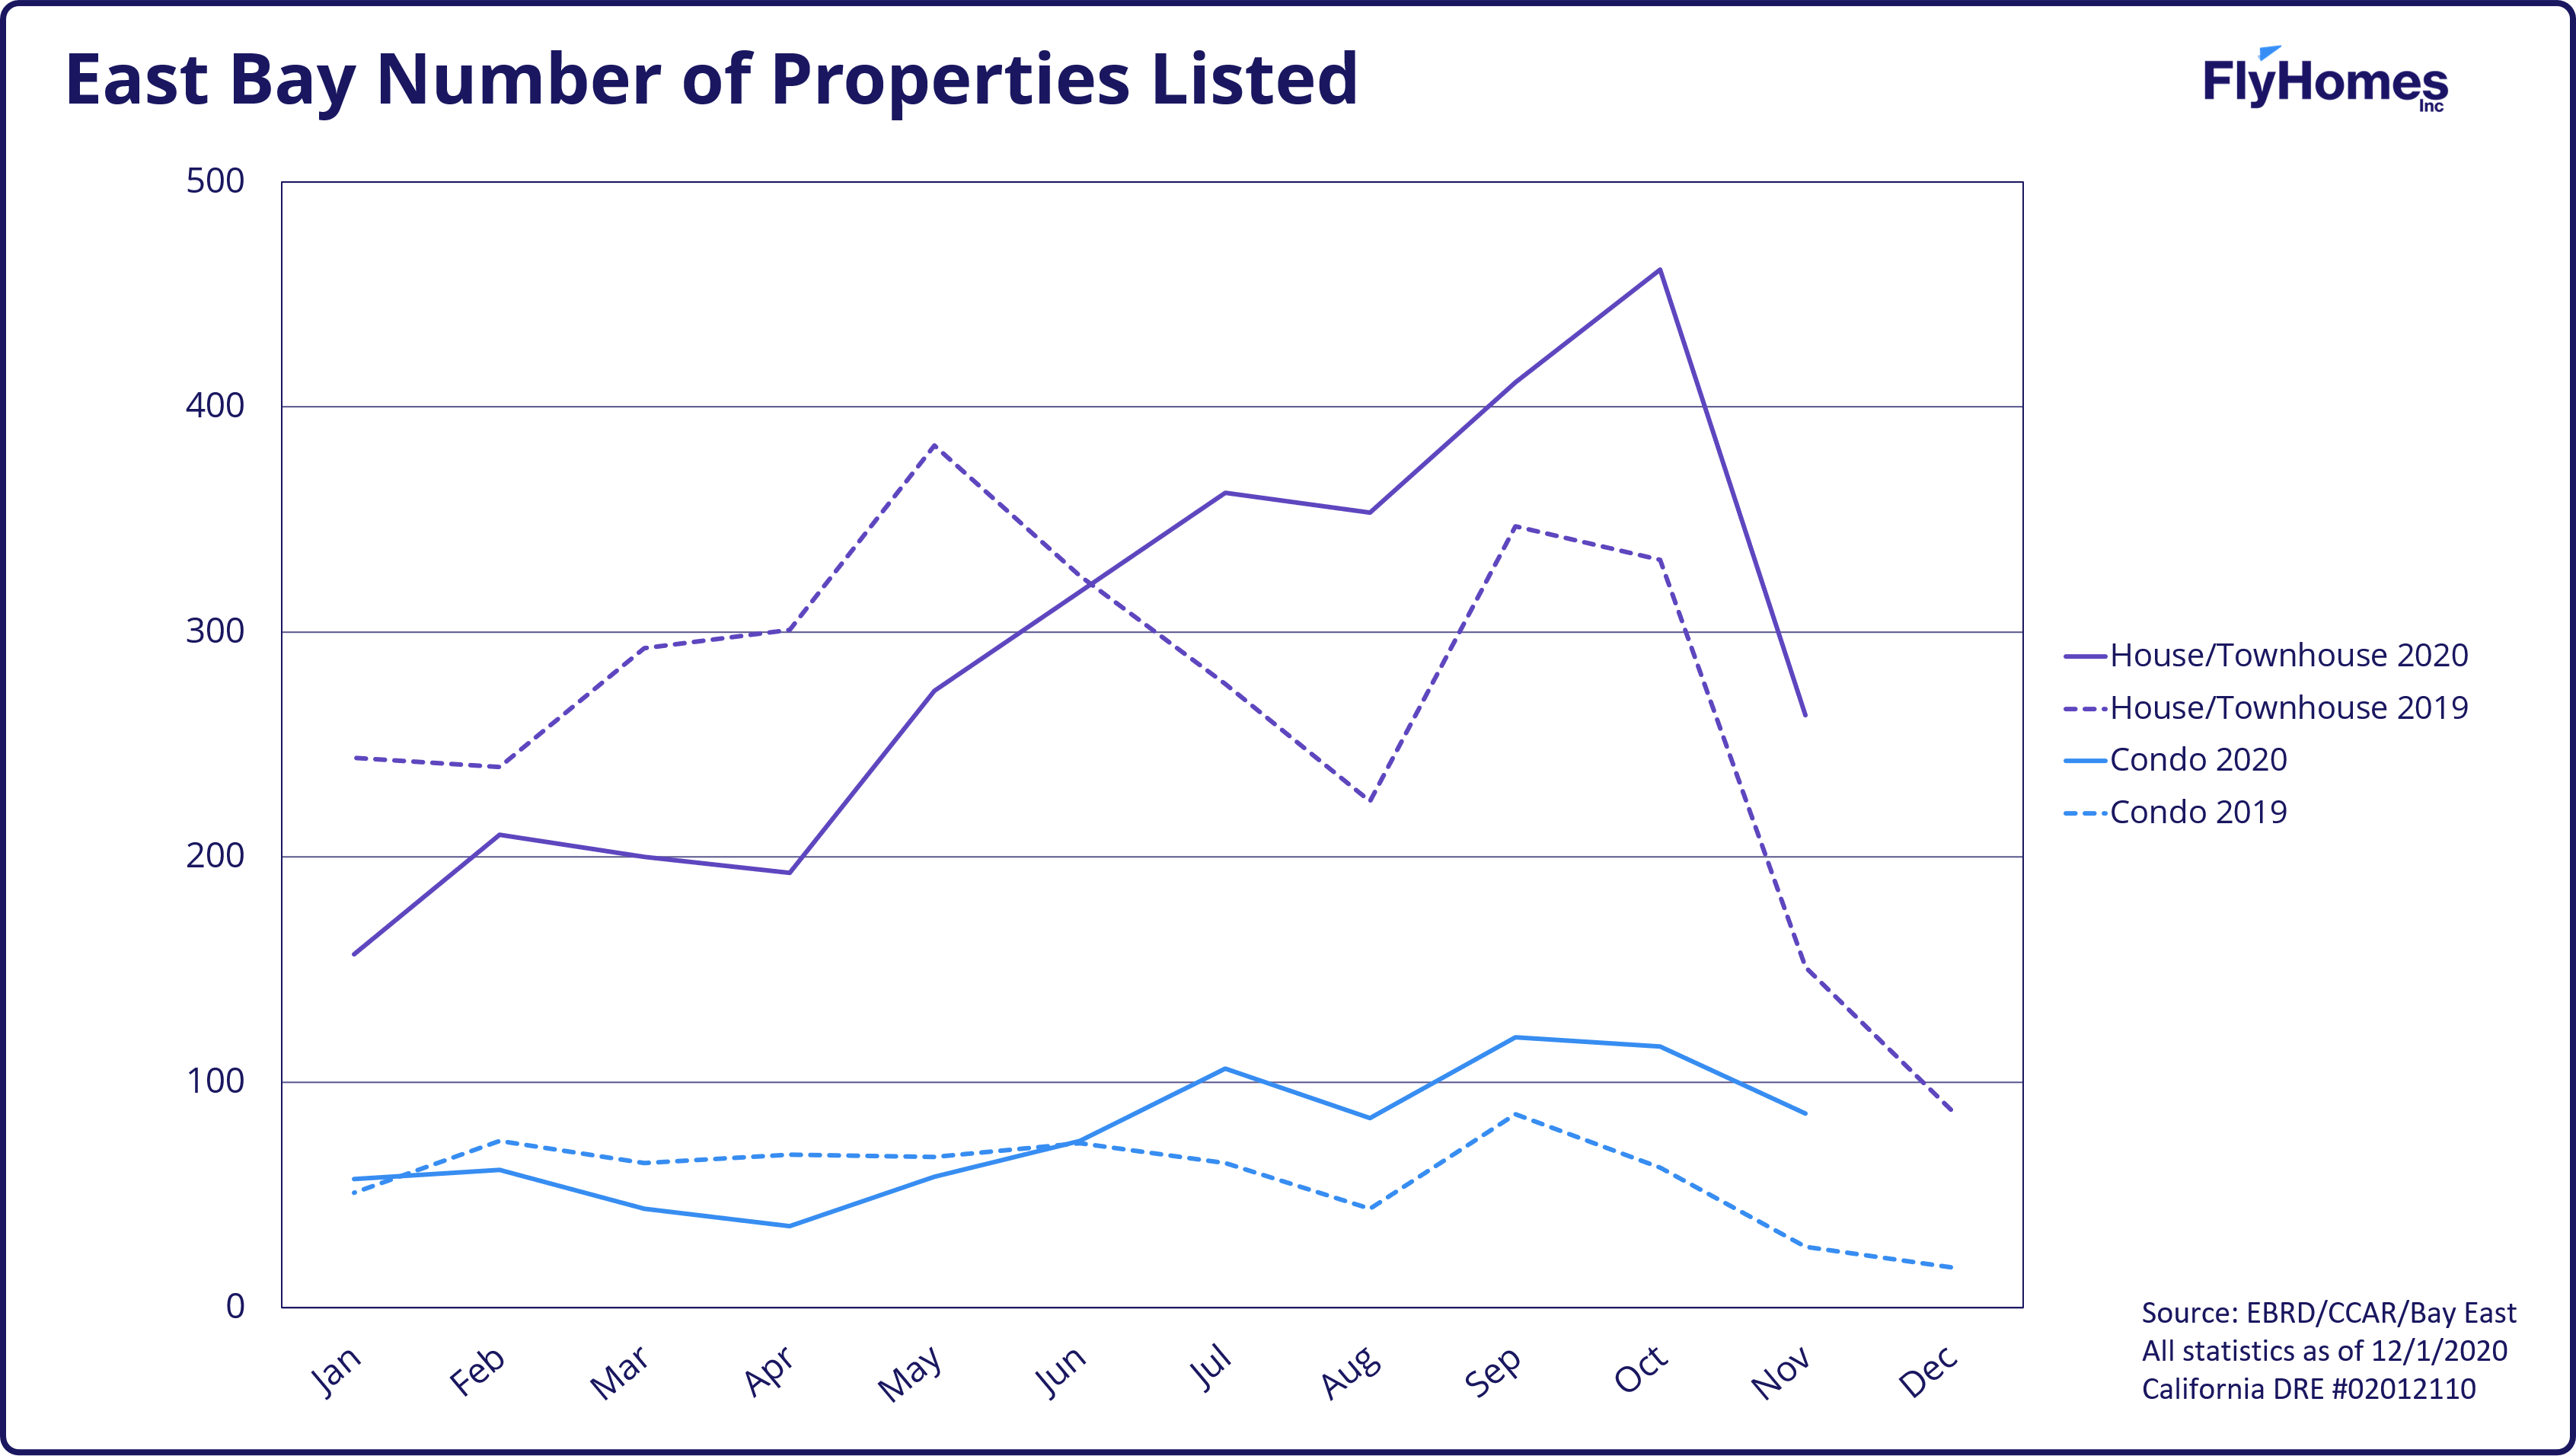
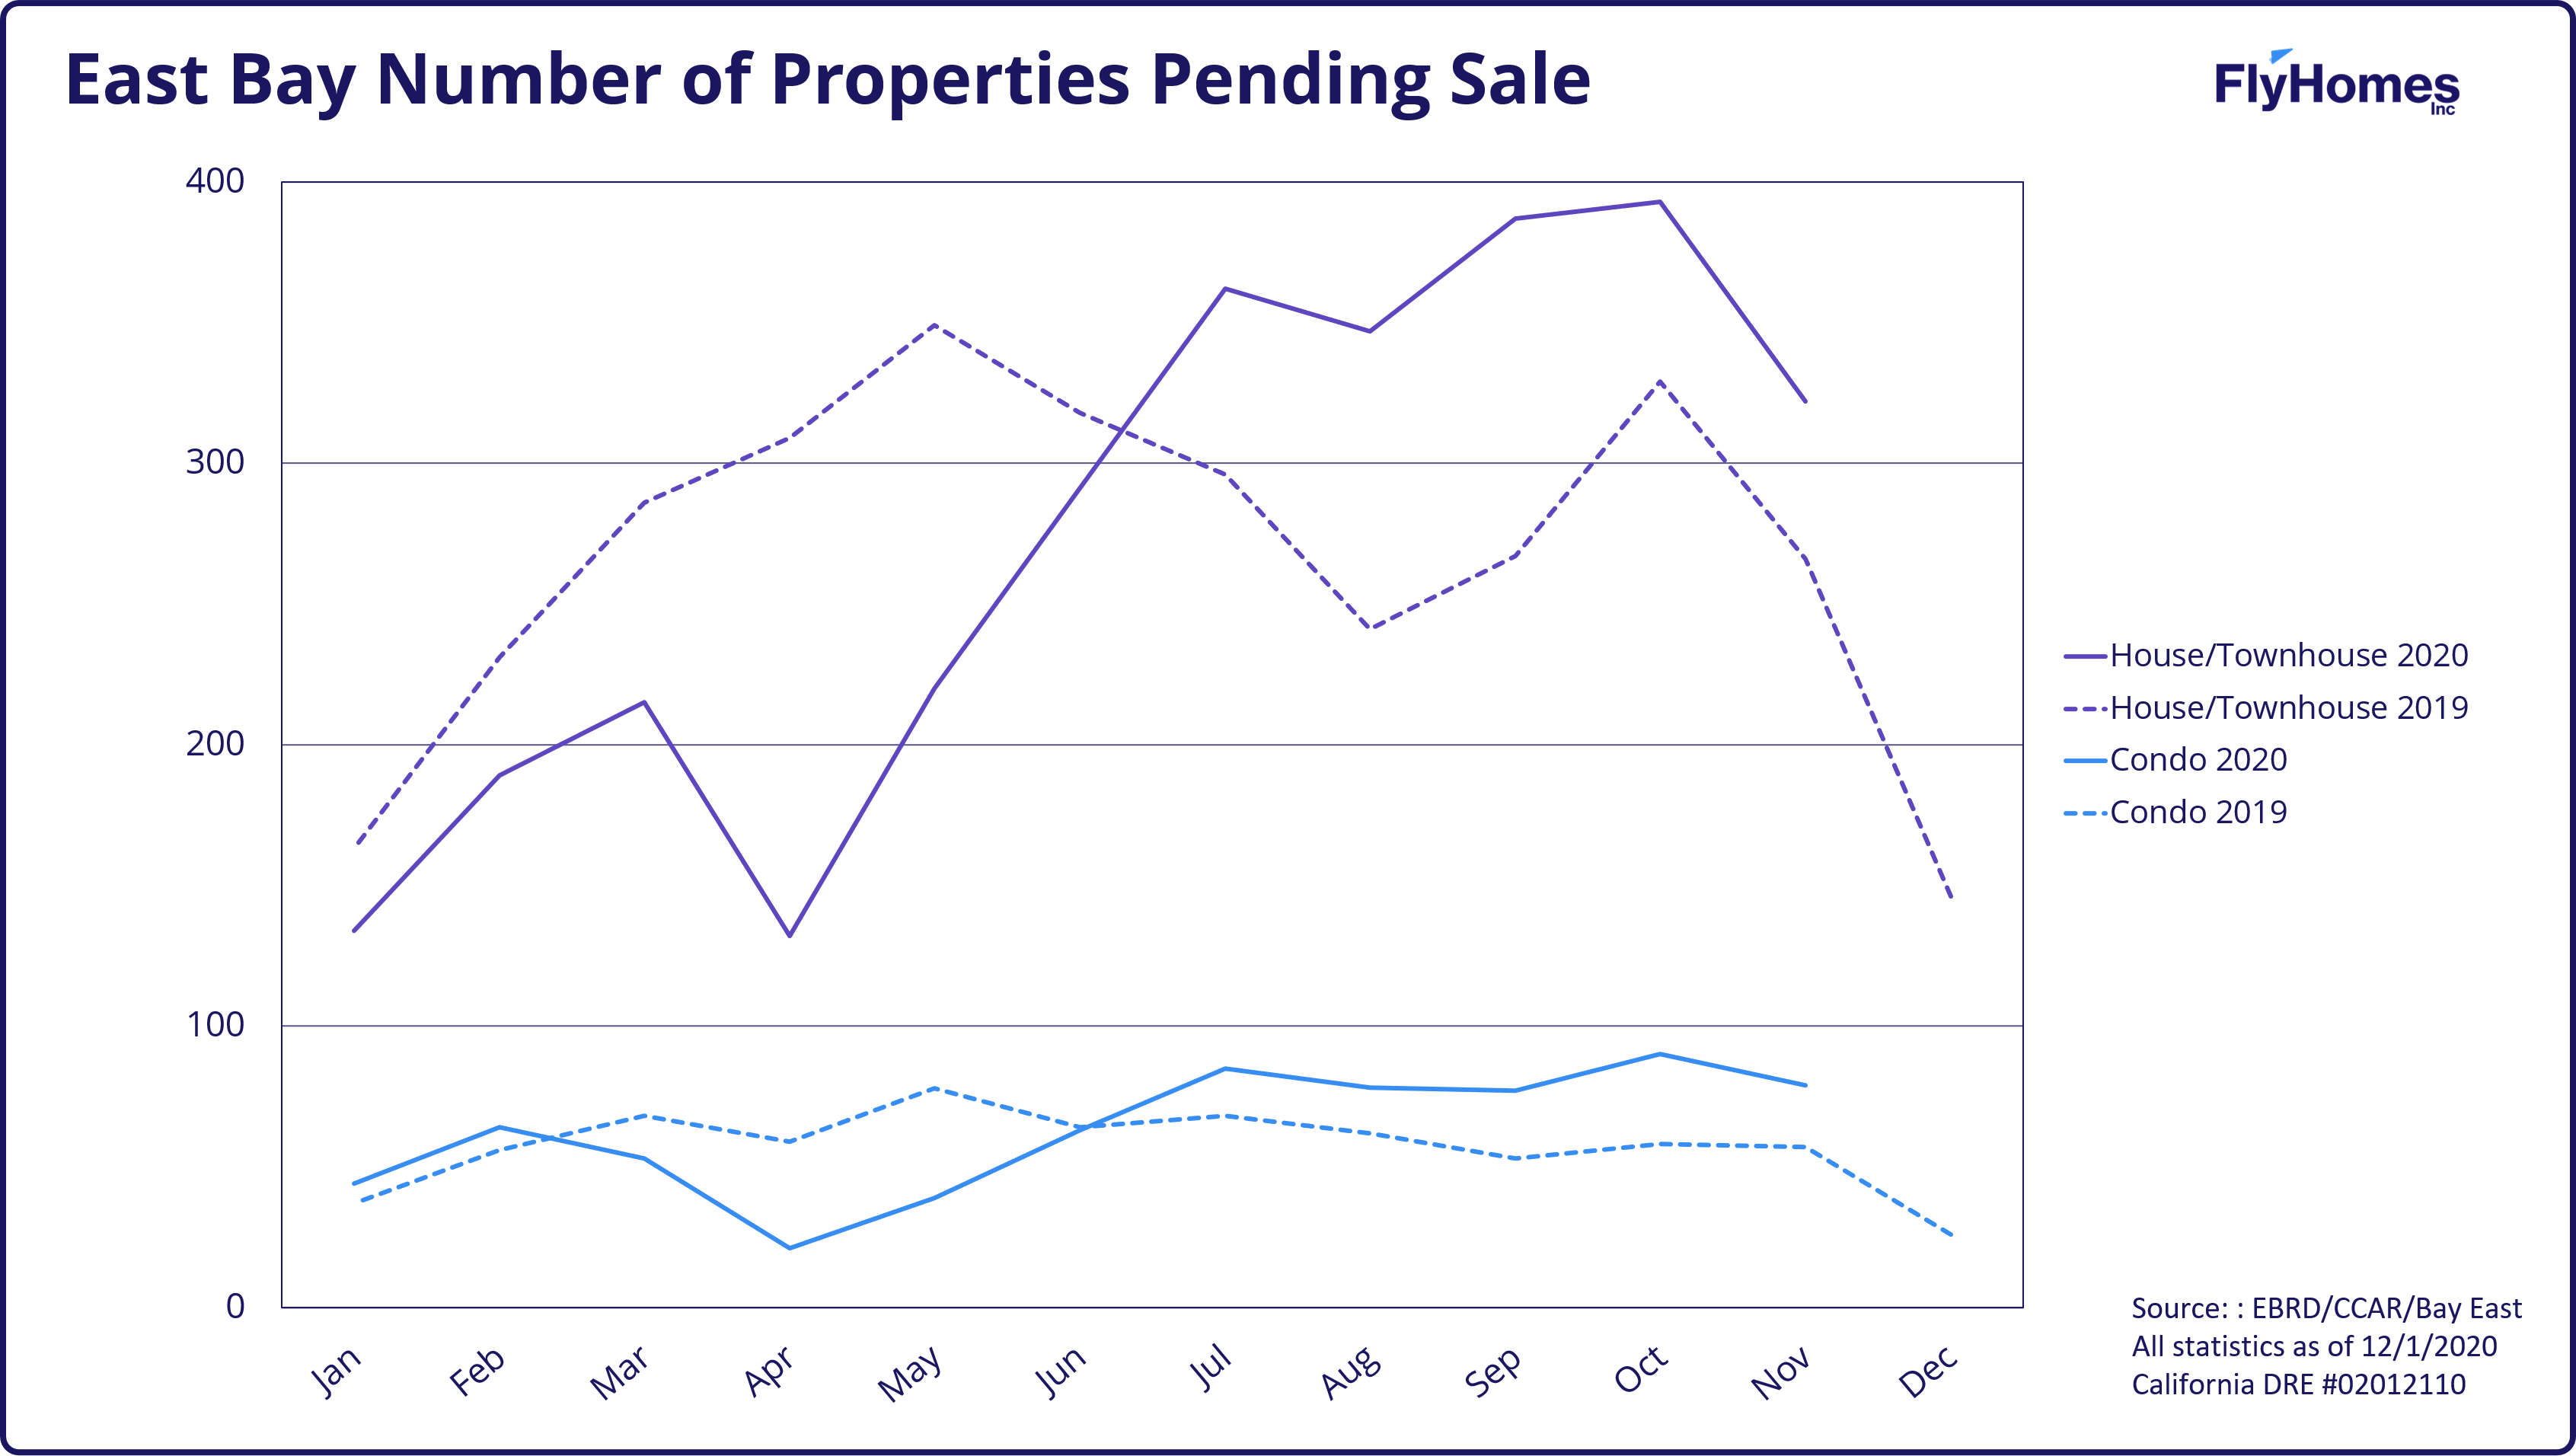
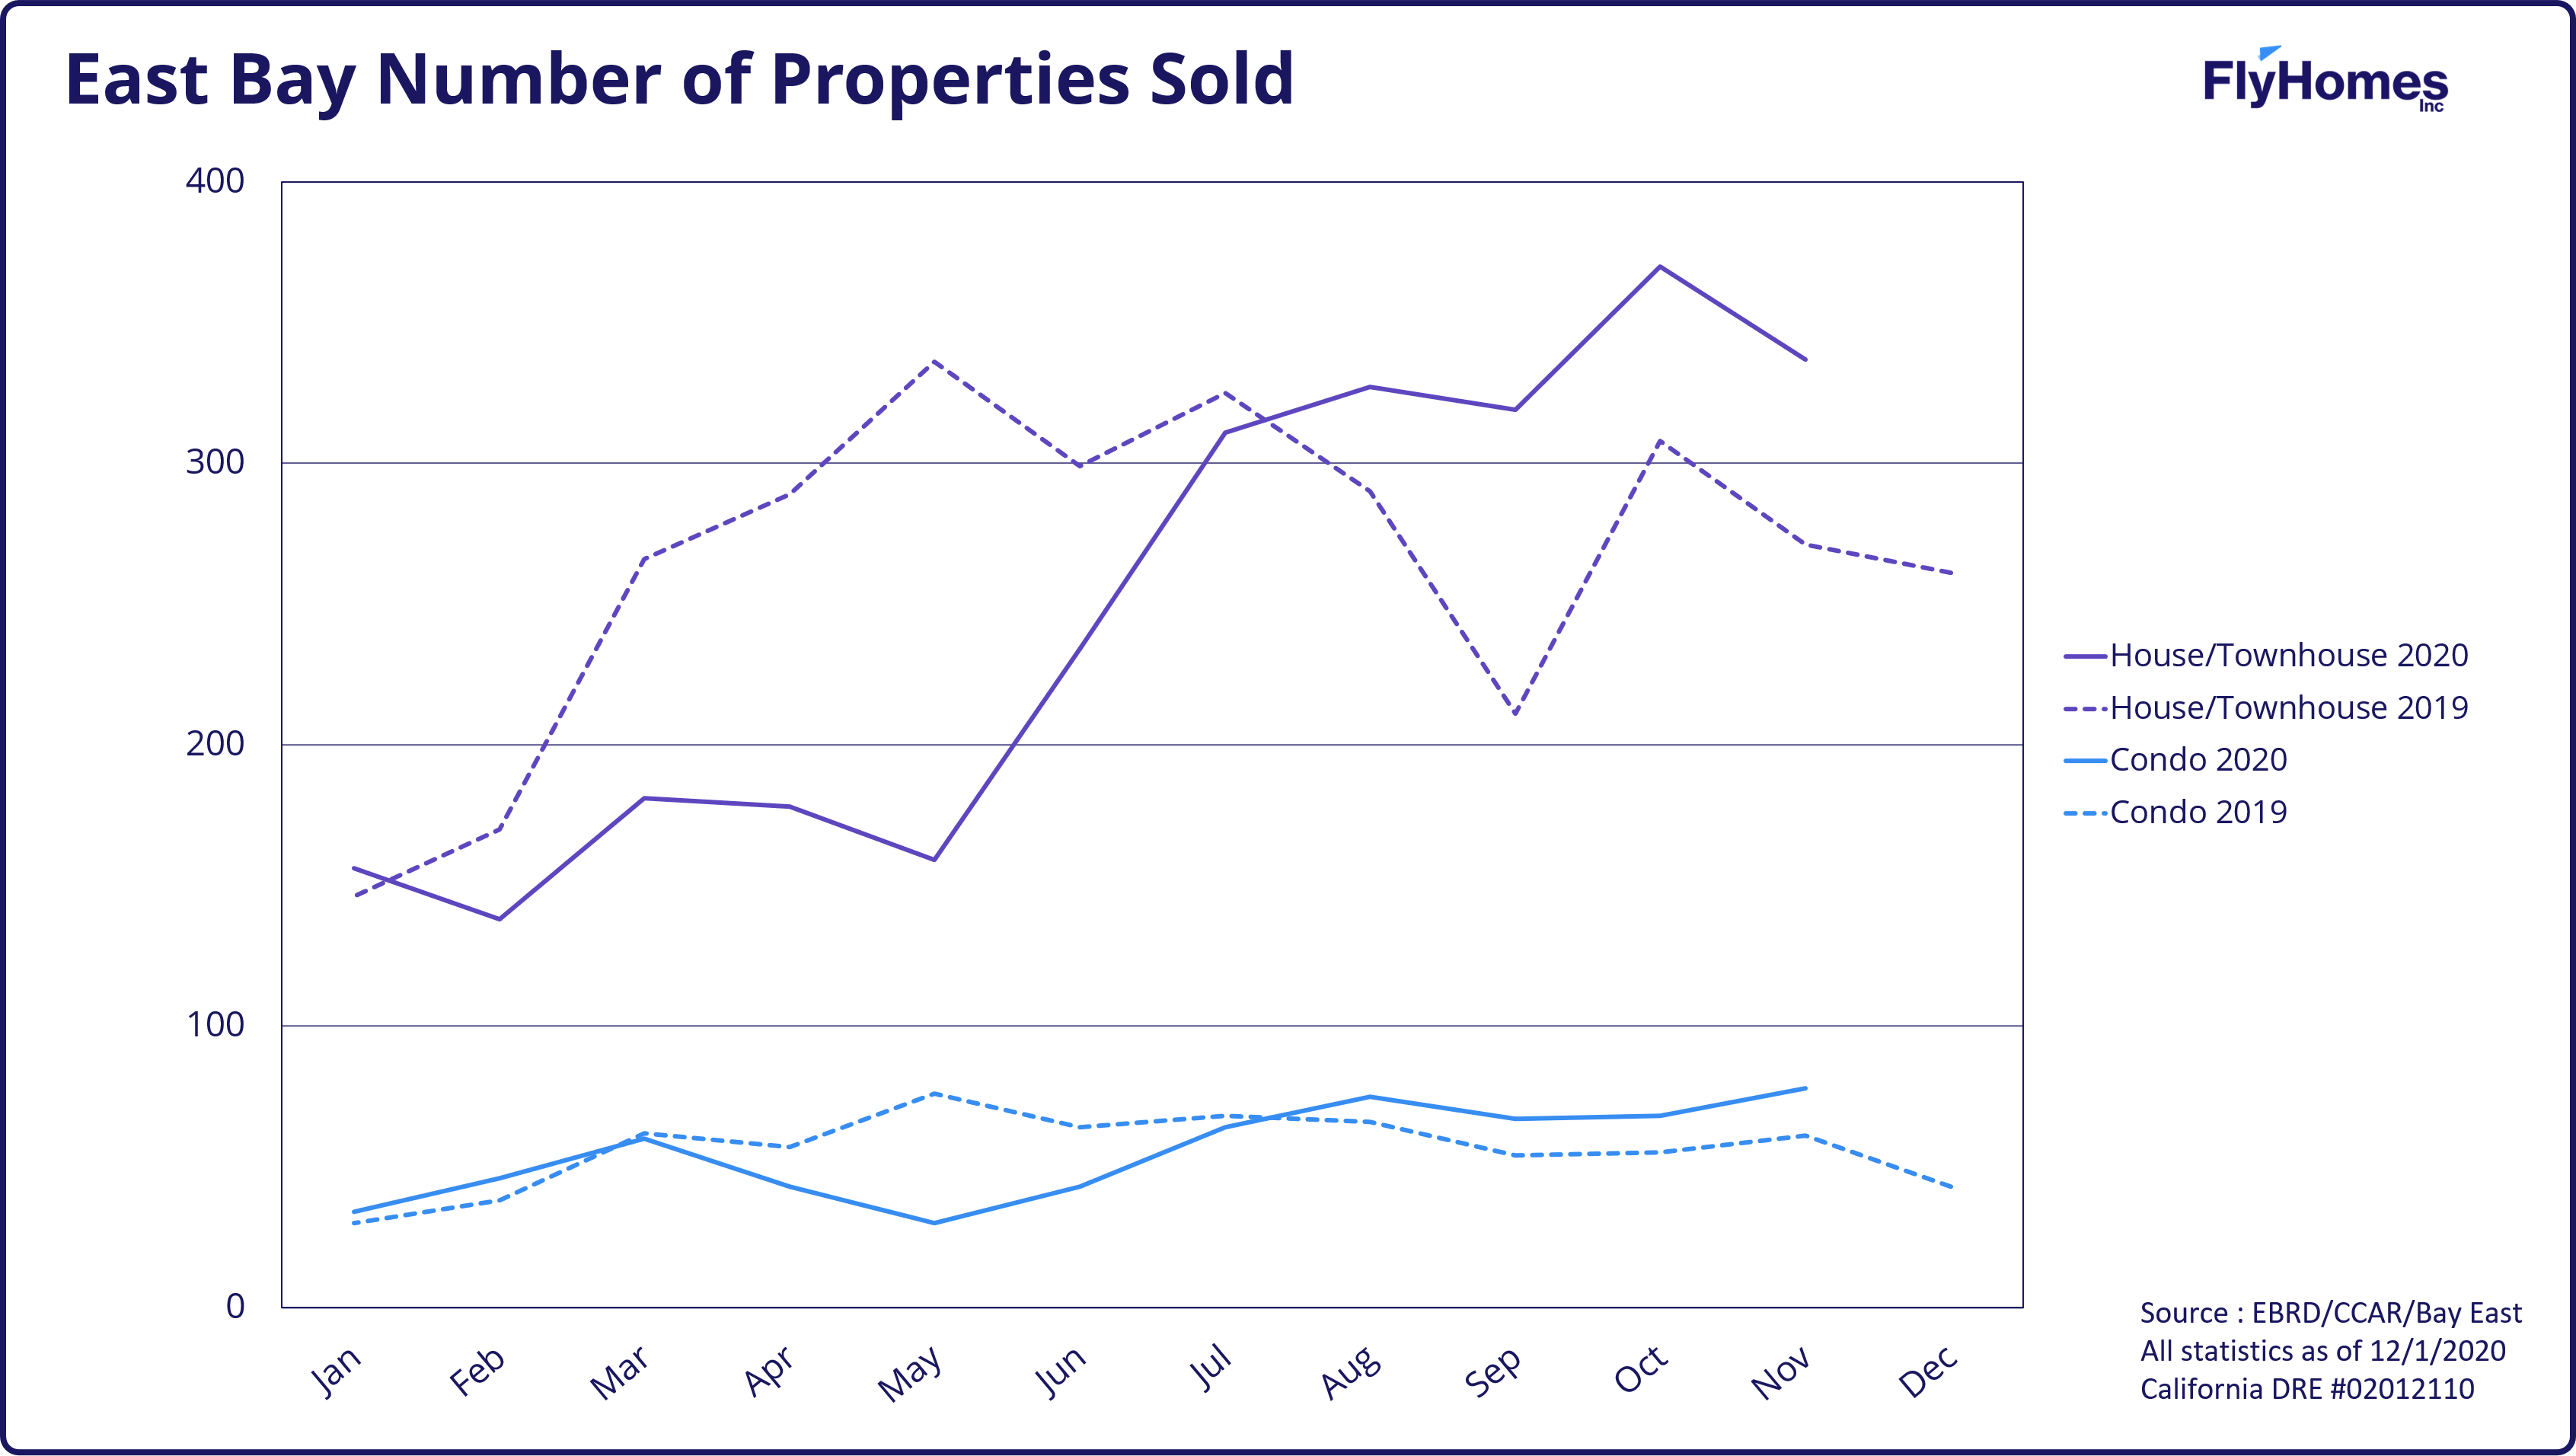
- The East Bay is seeing strong competition for single family homes with sale-to-list-price ratio rising to 113% and outpacing the usual yearly trend. Sellers are listing at lower prices to invite competition and drive up sale price.
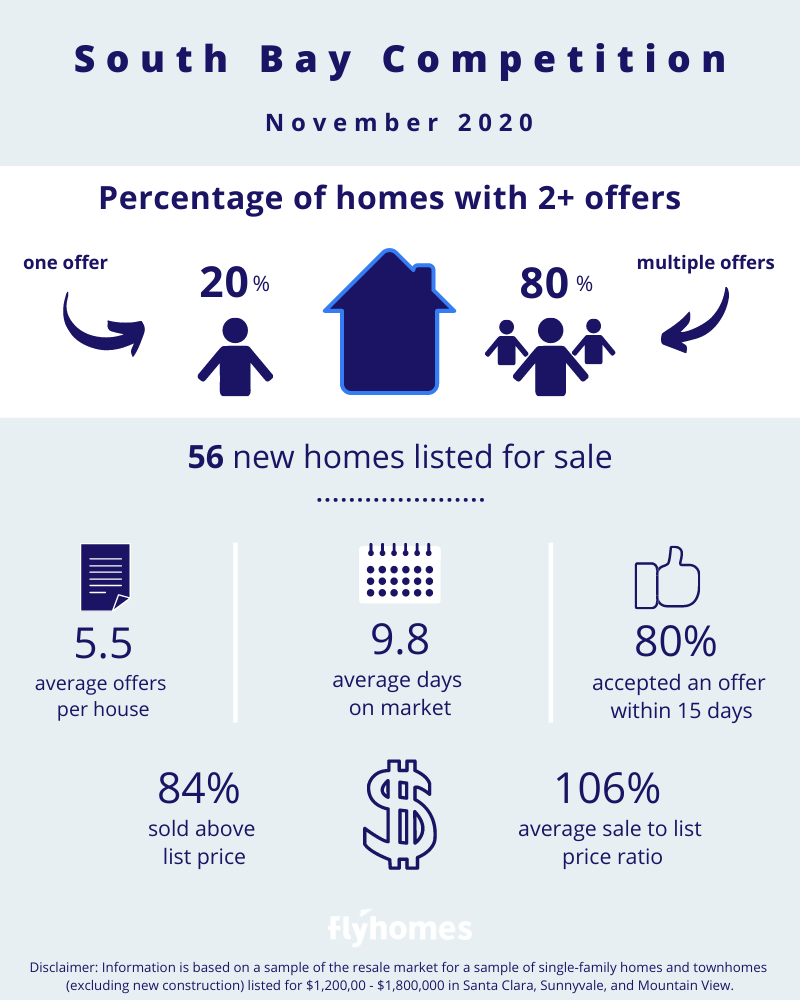
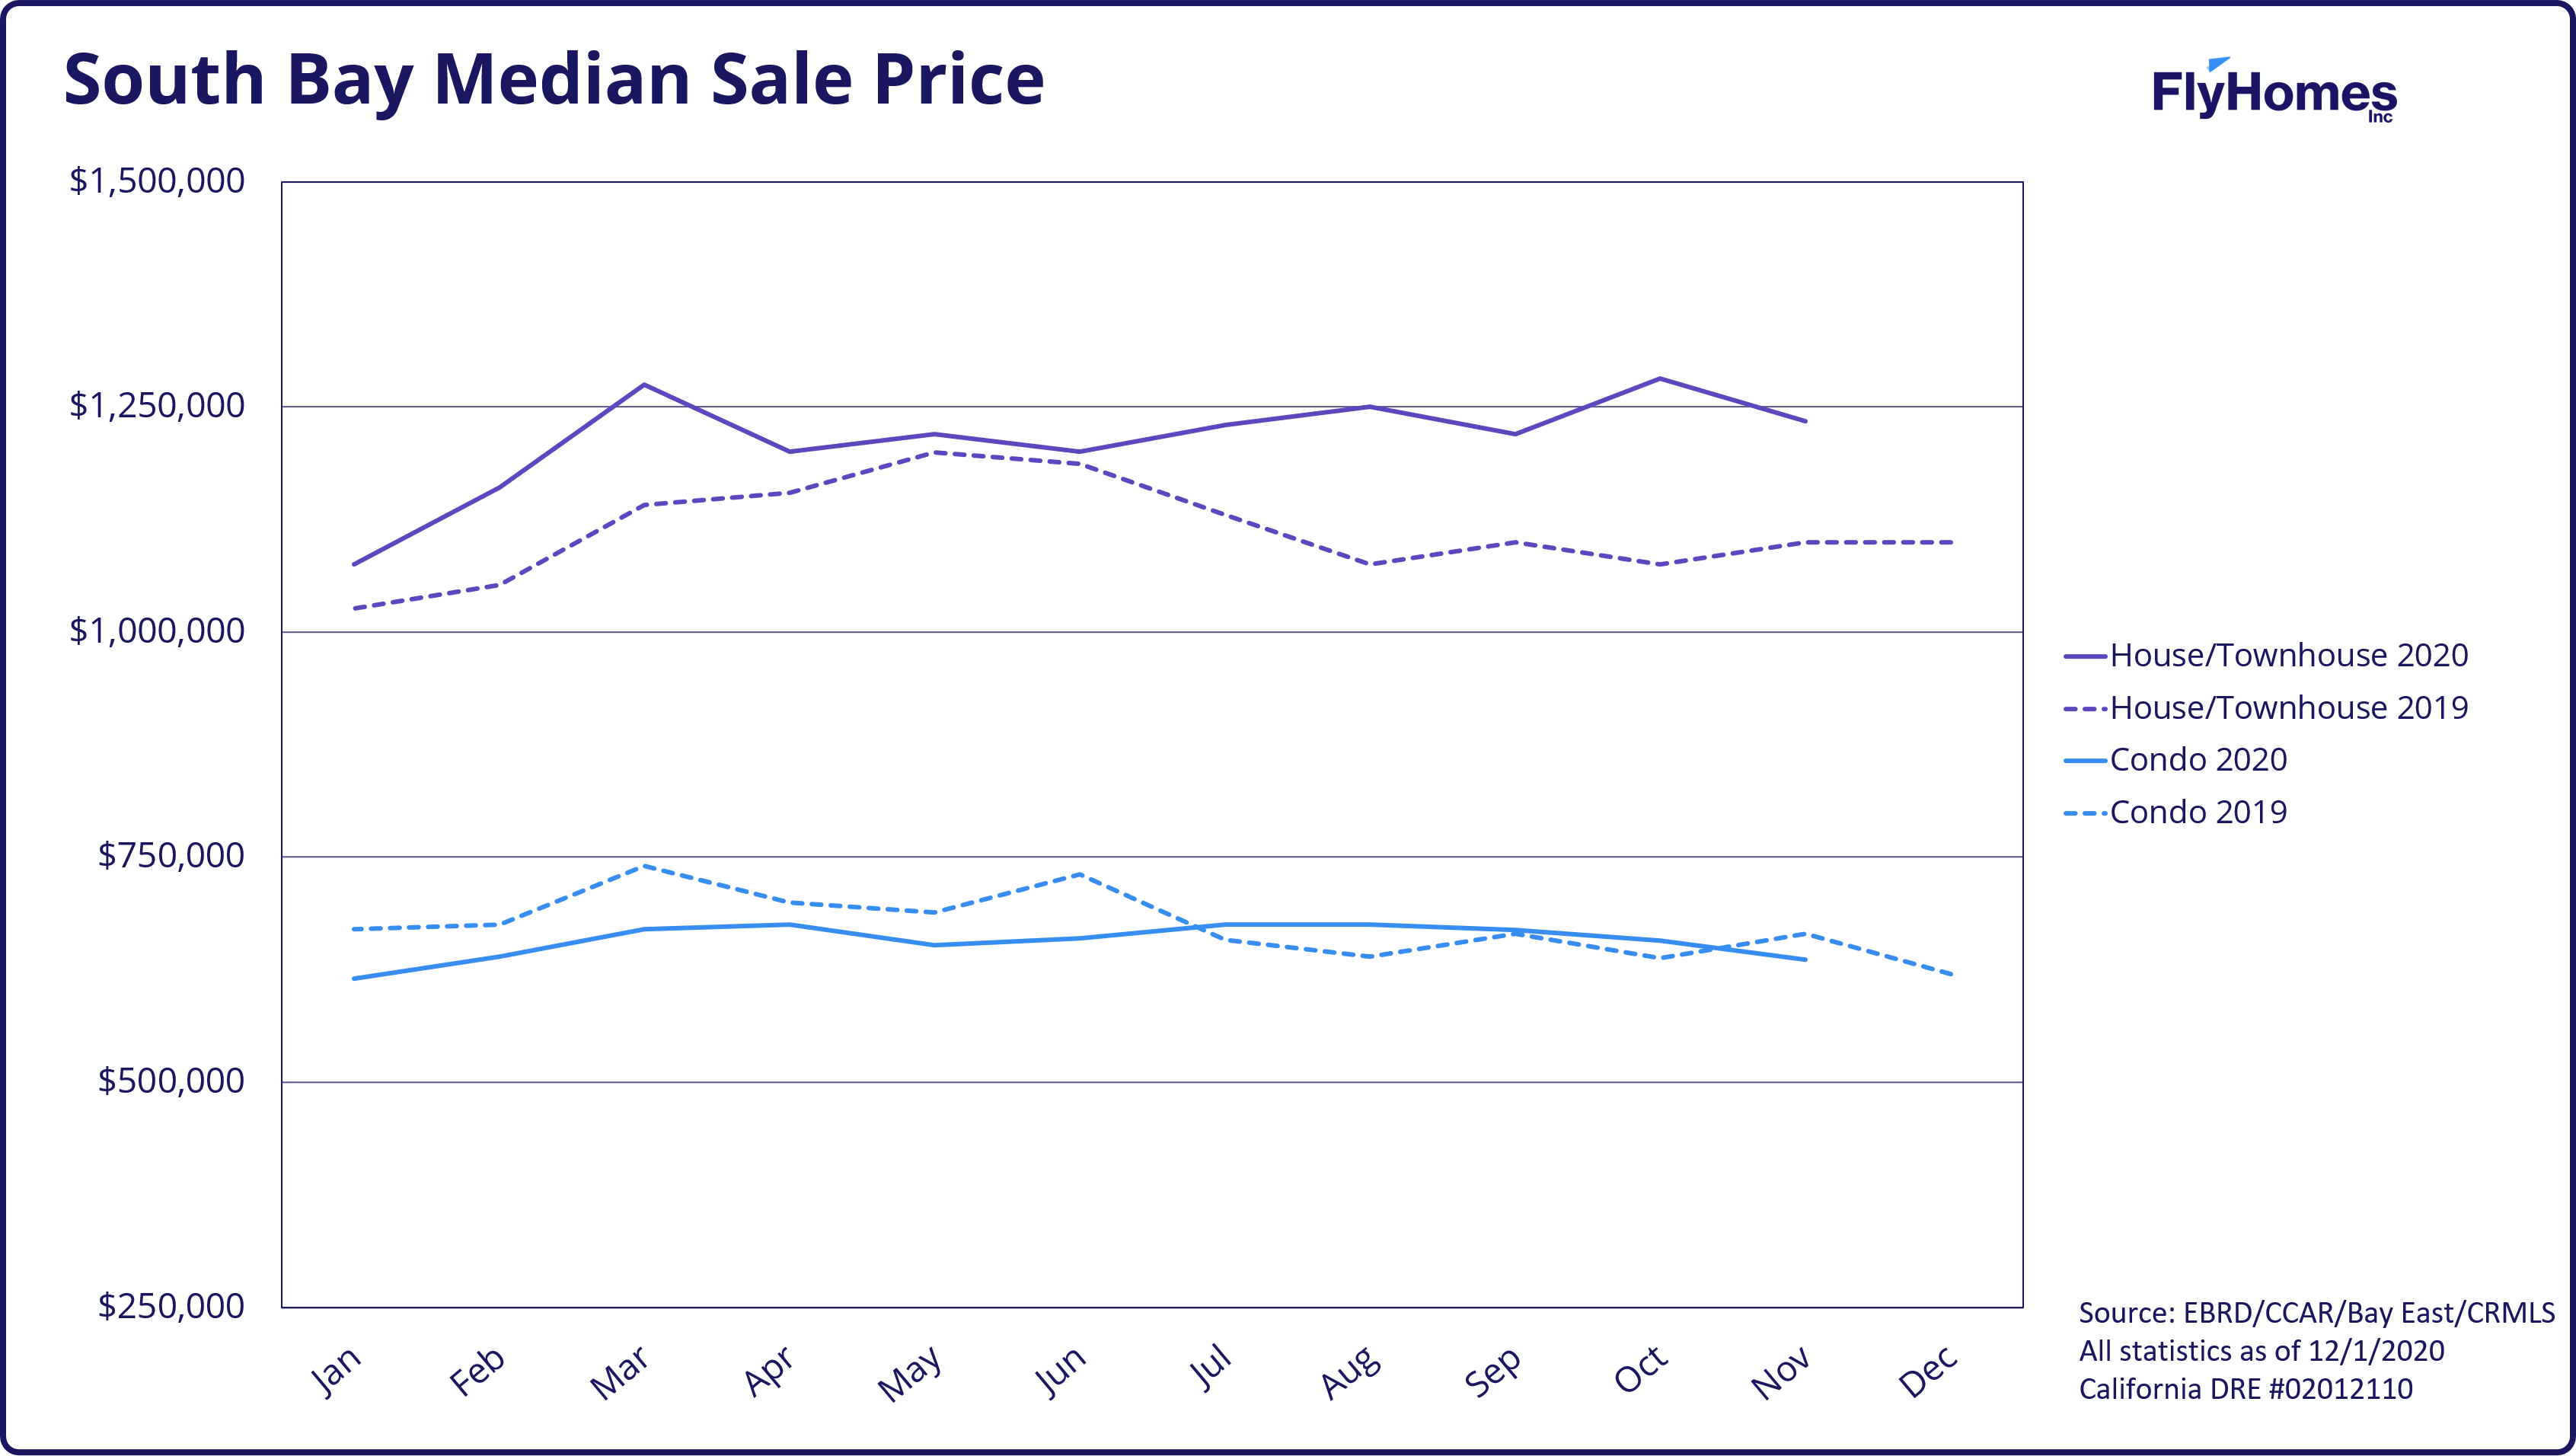
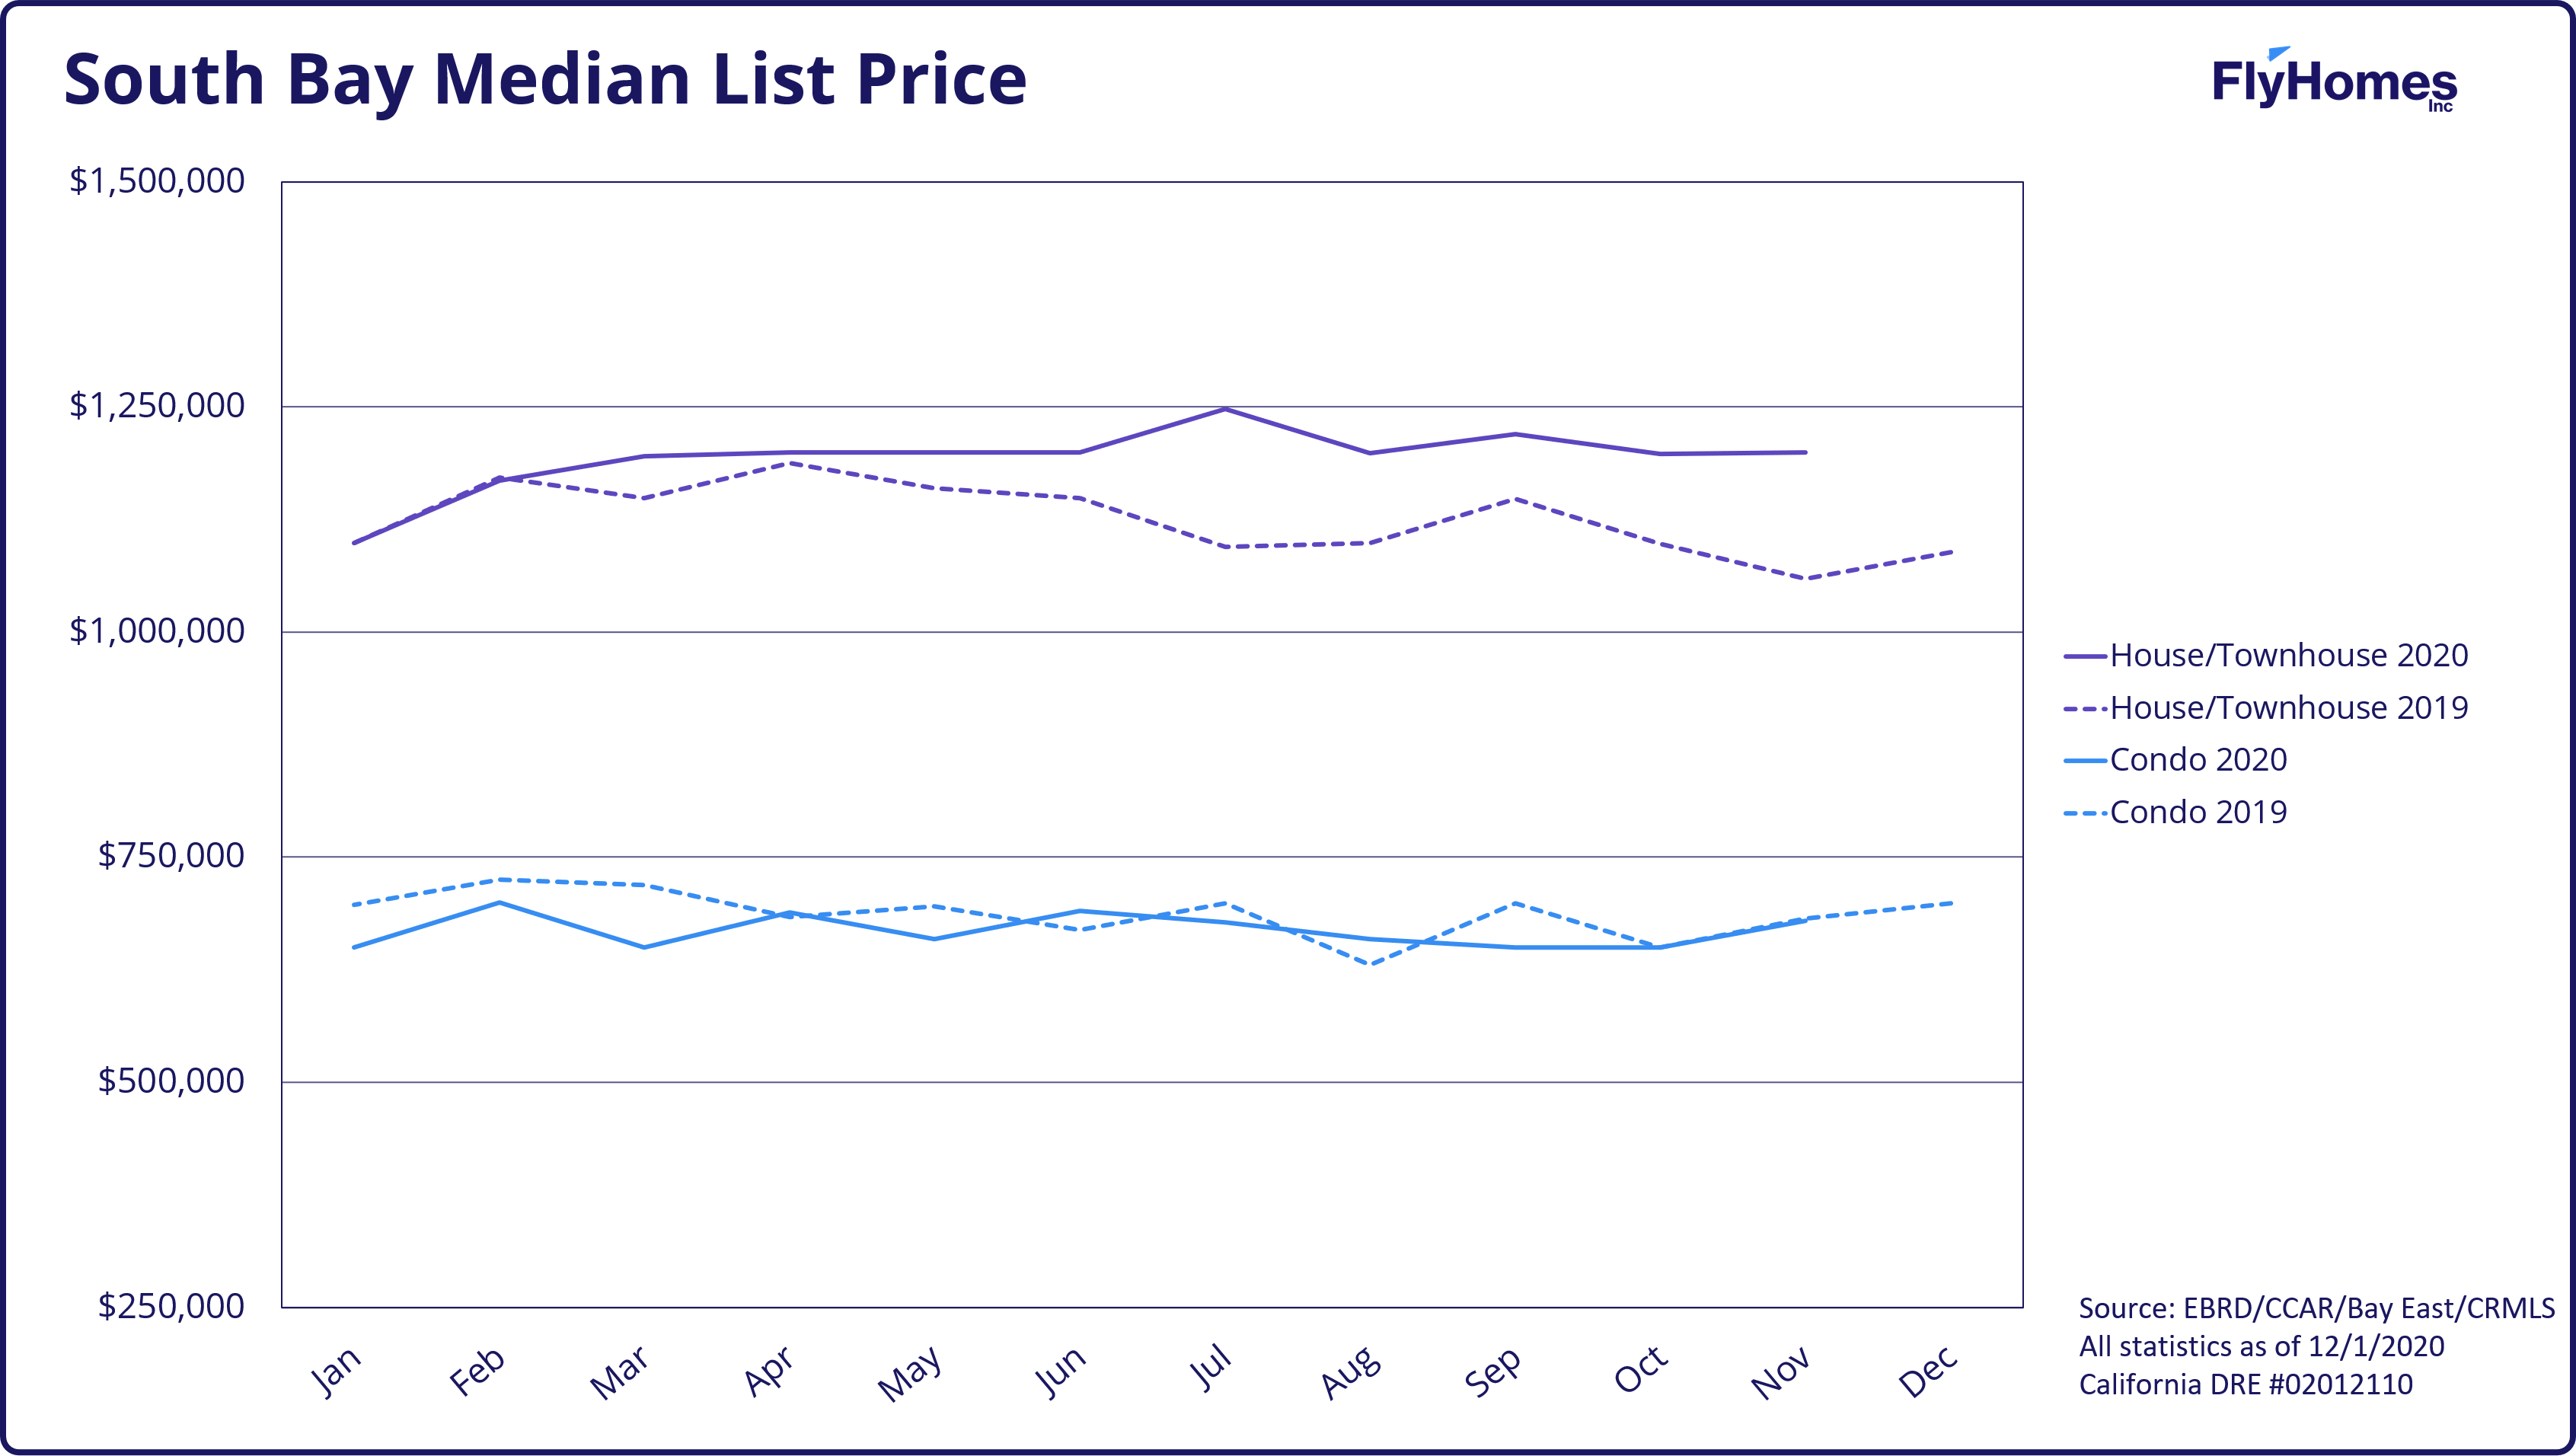
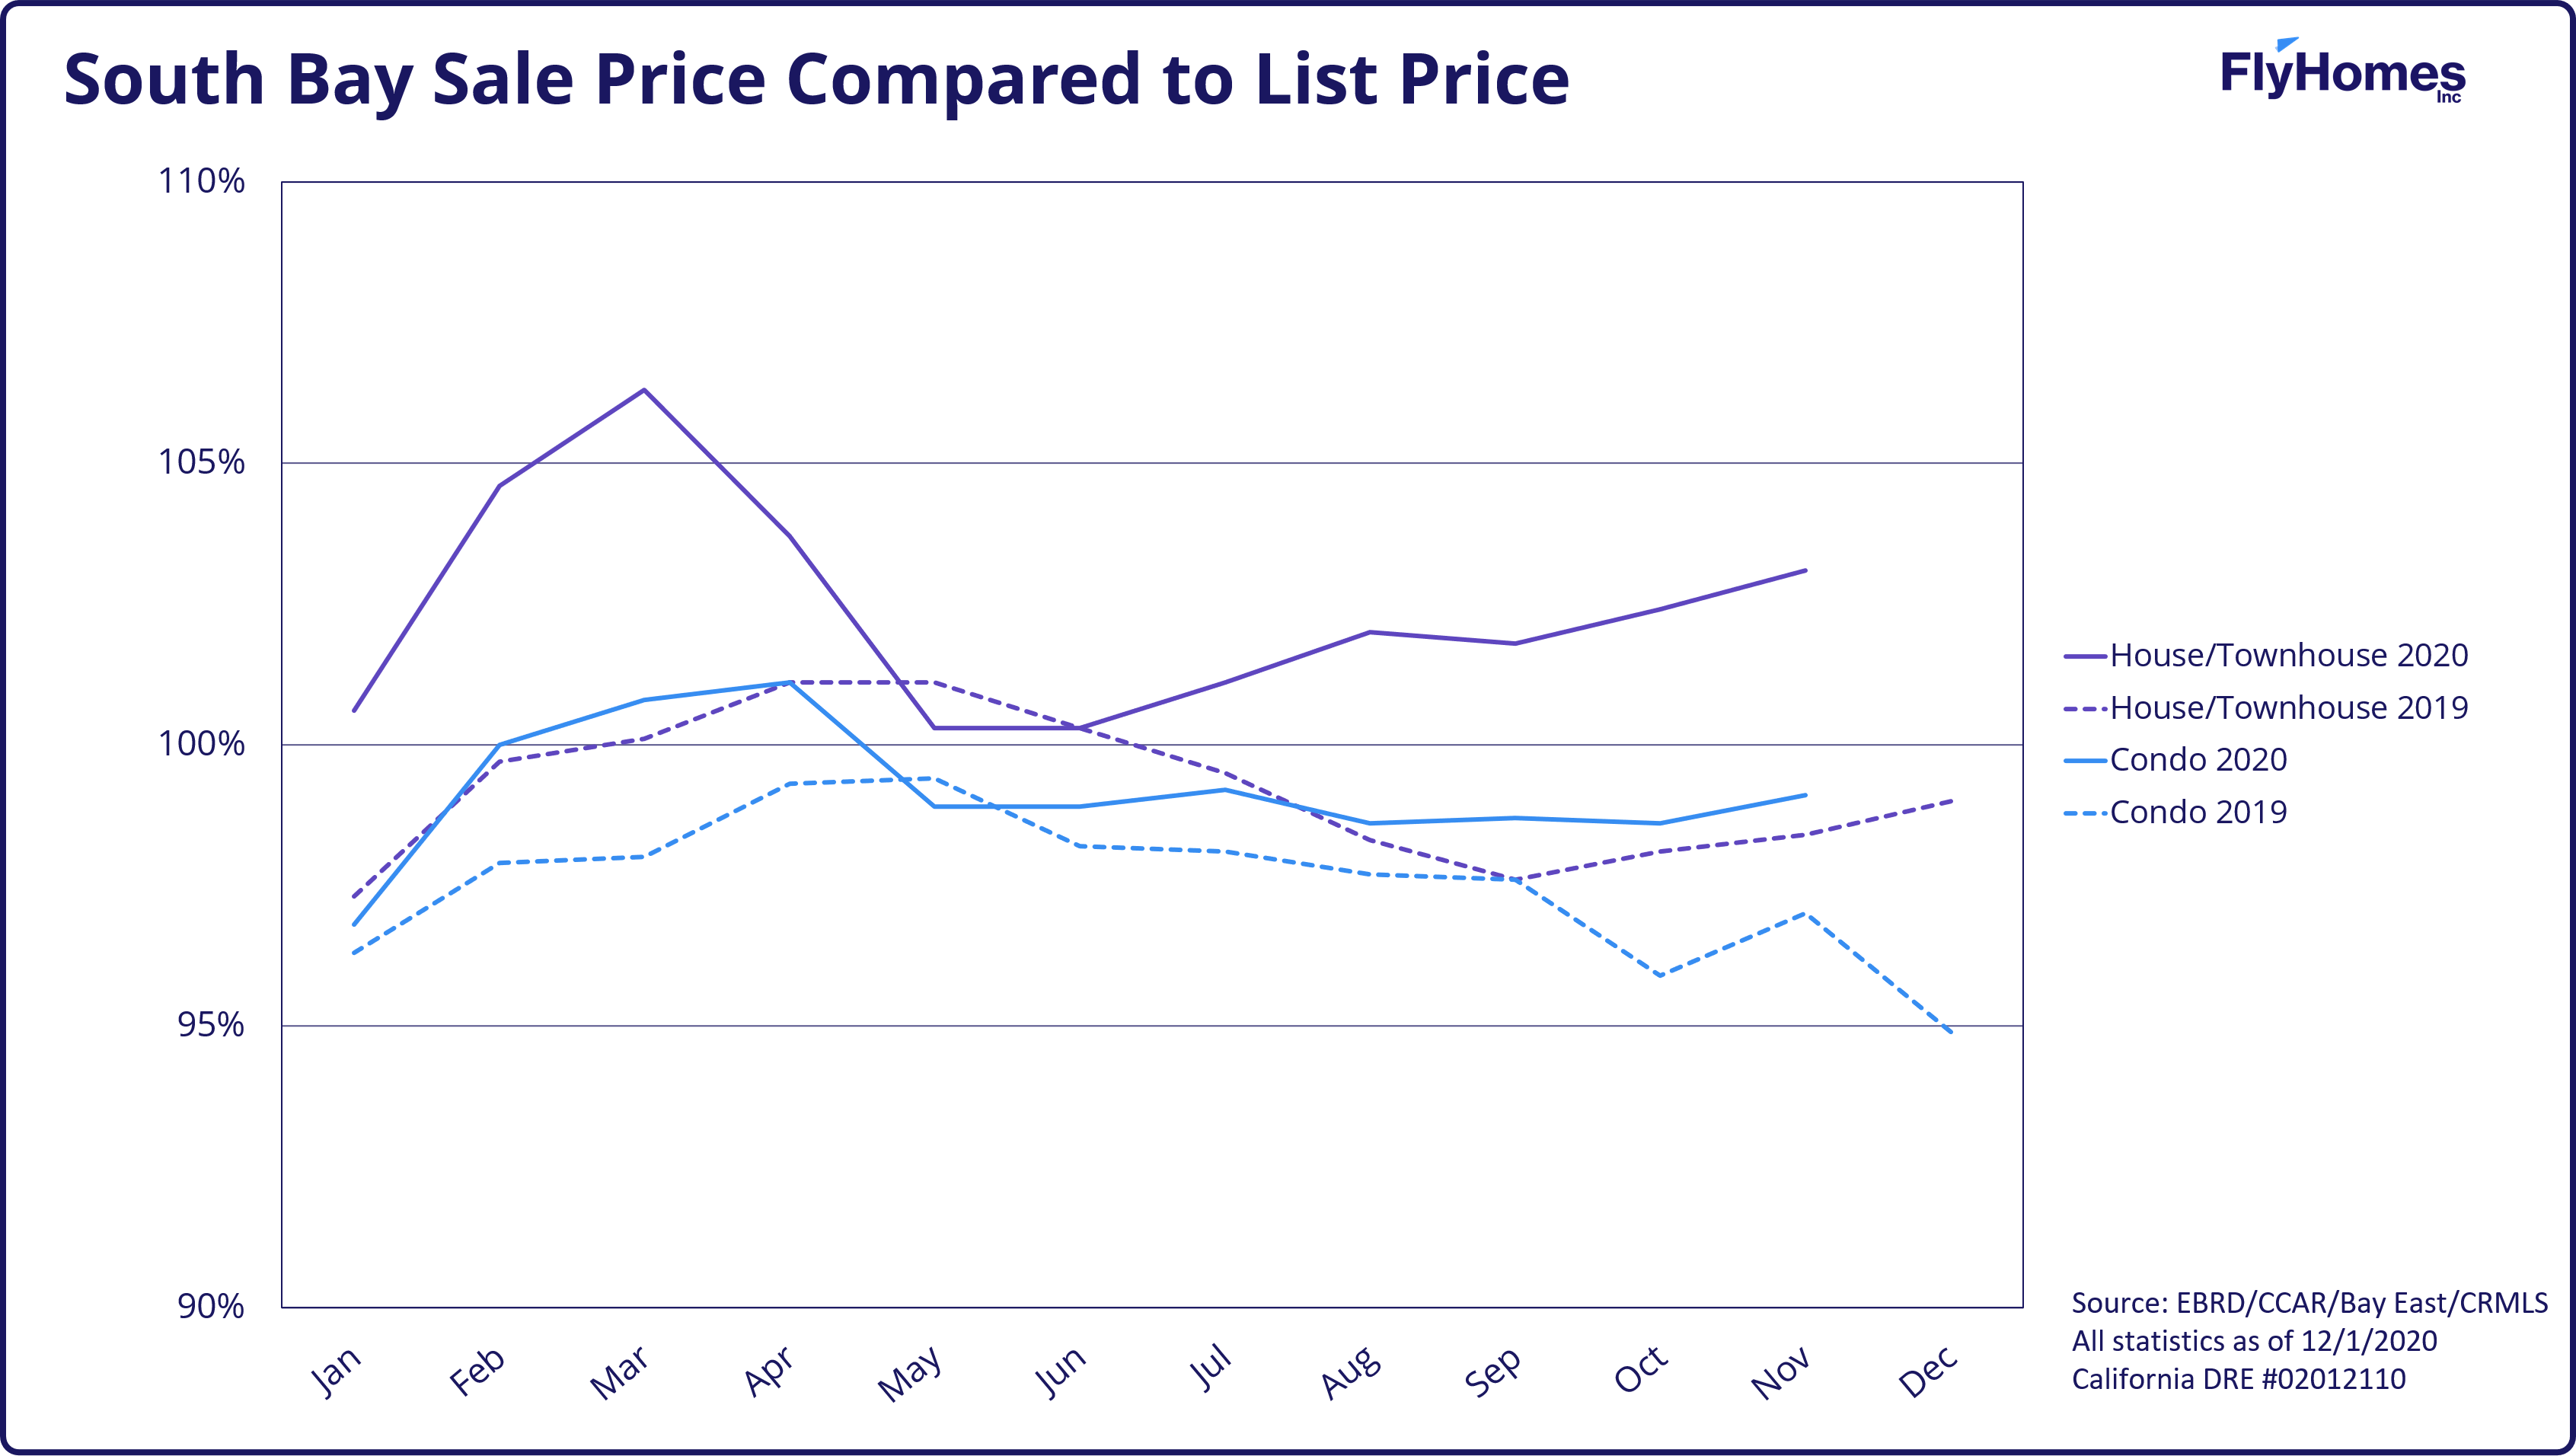
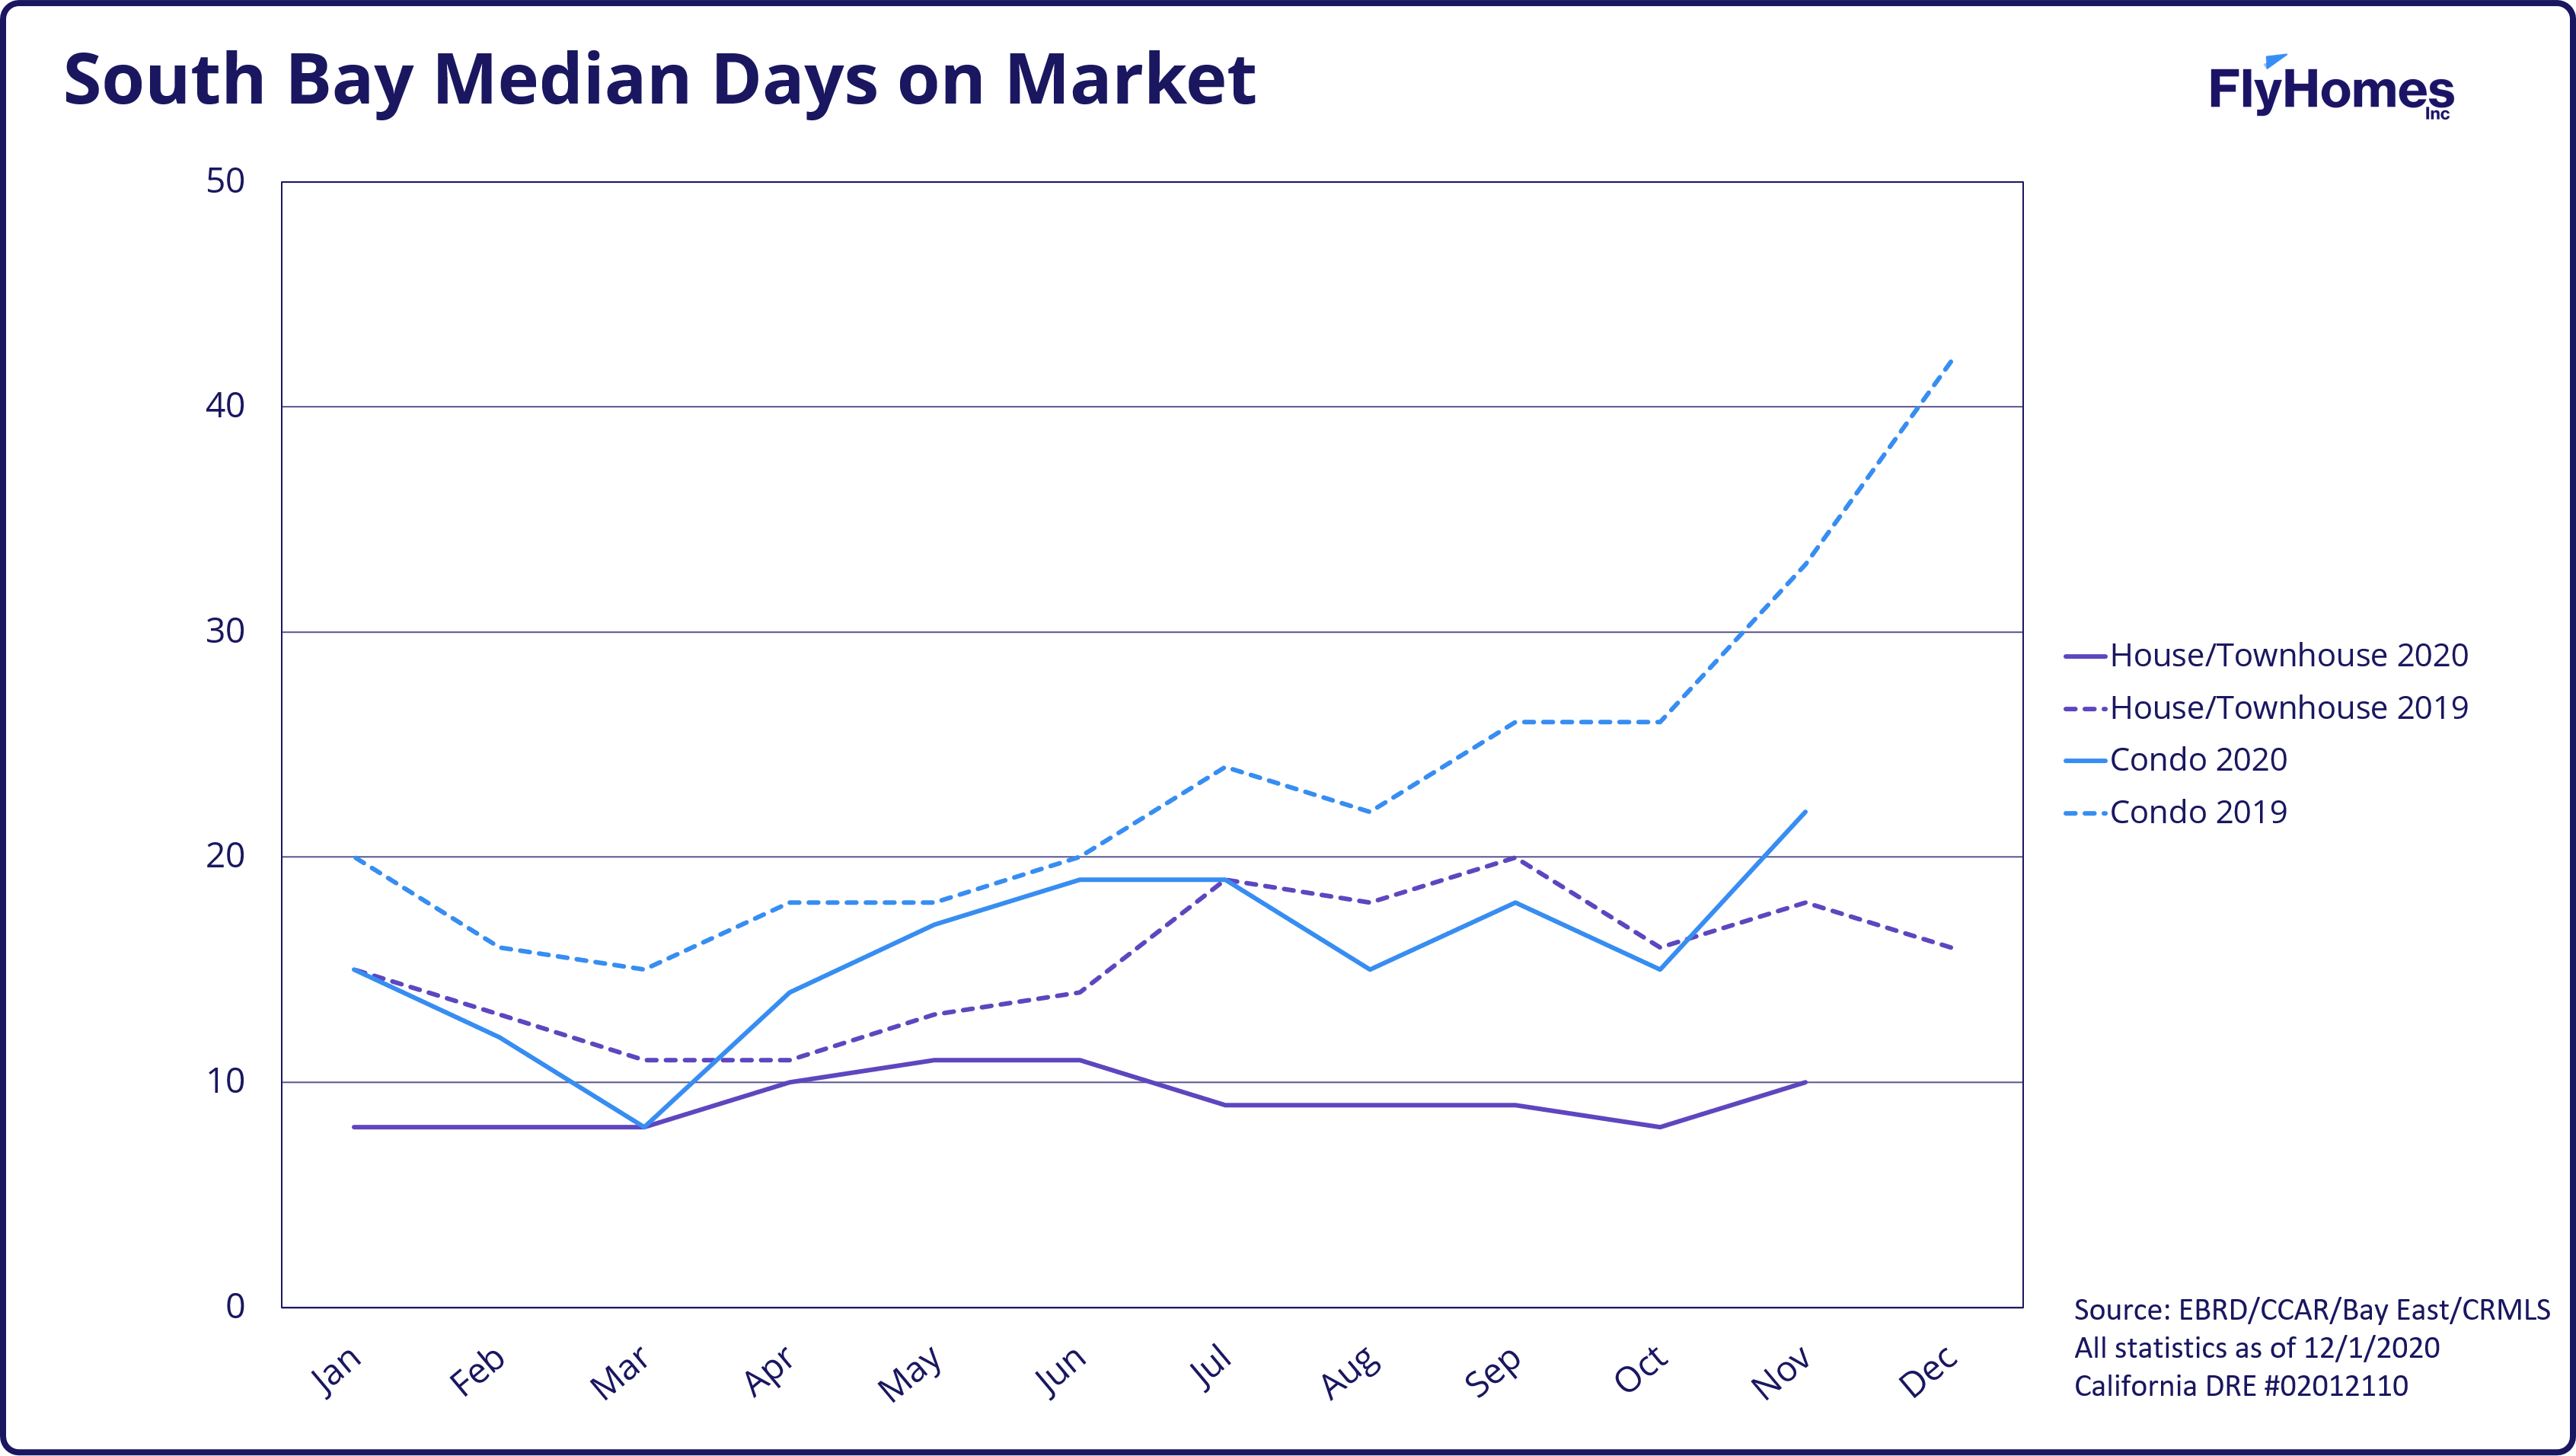
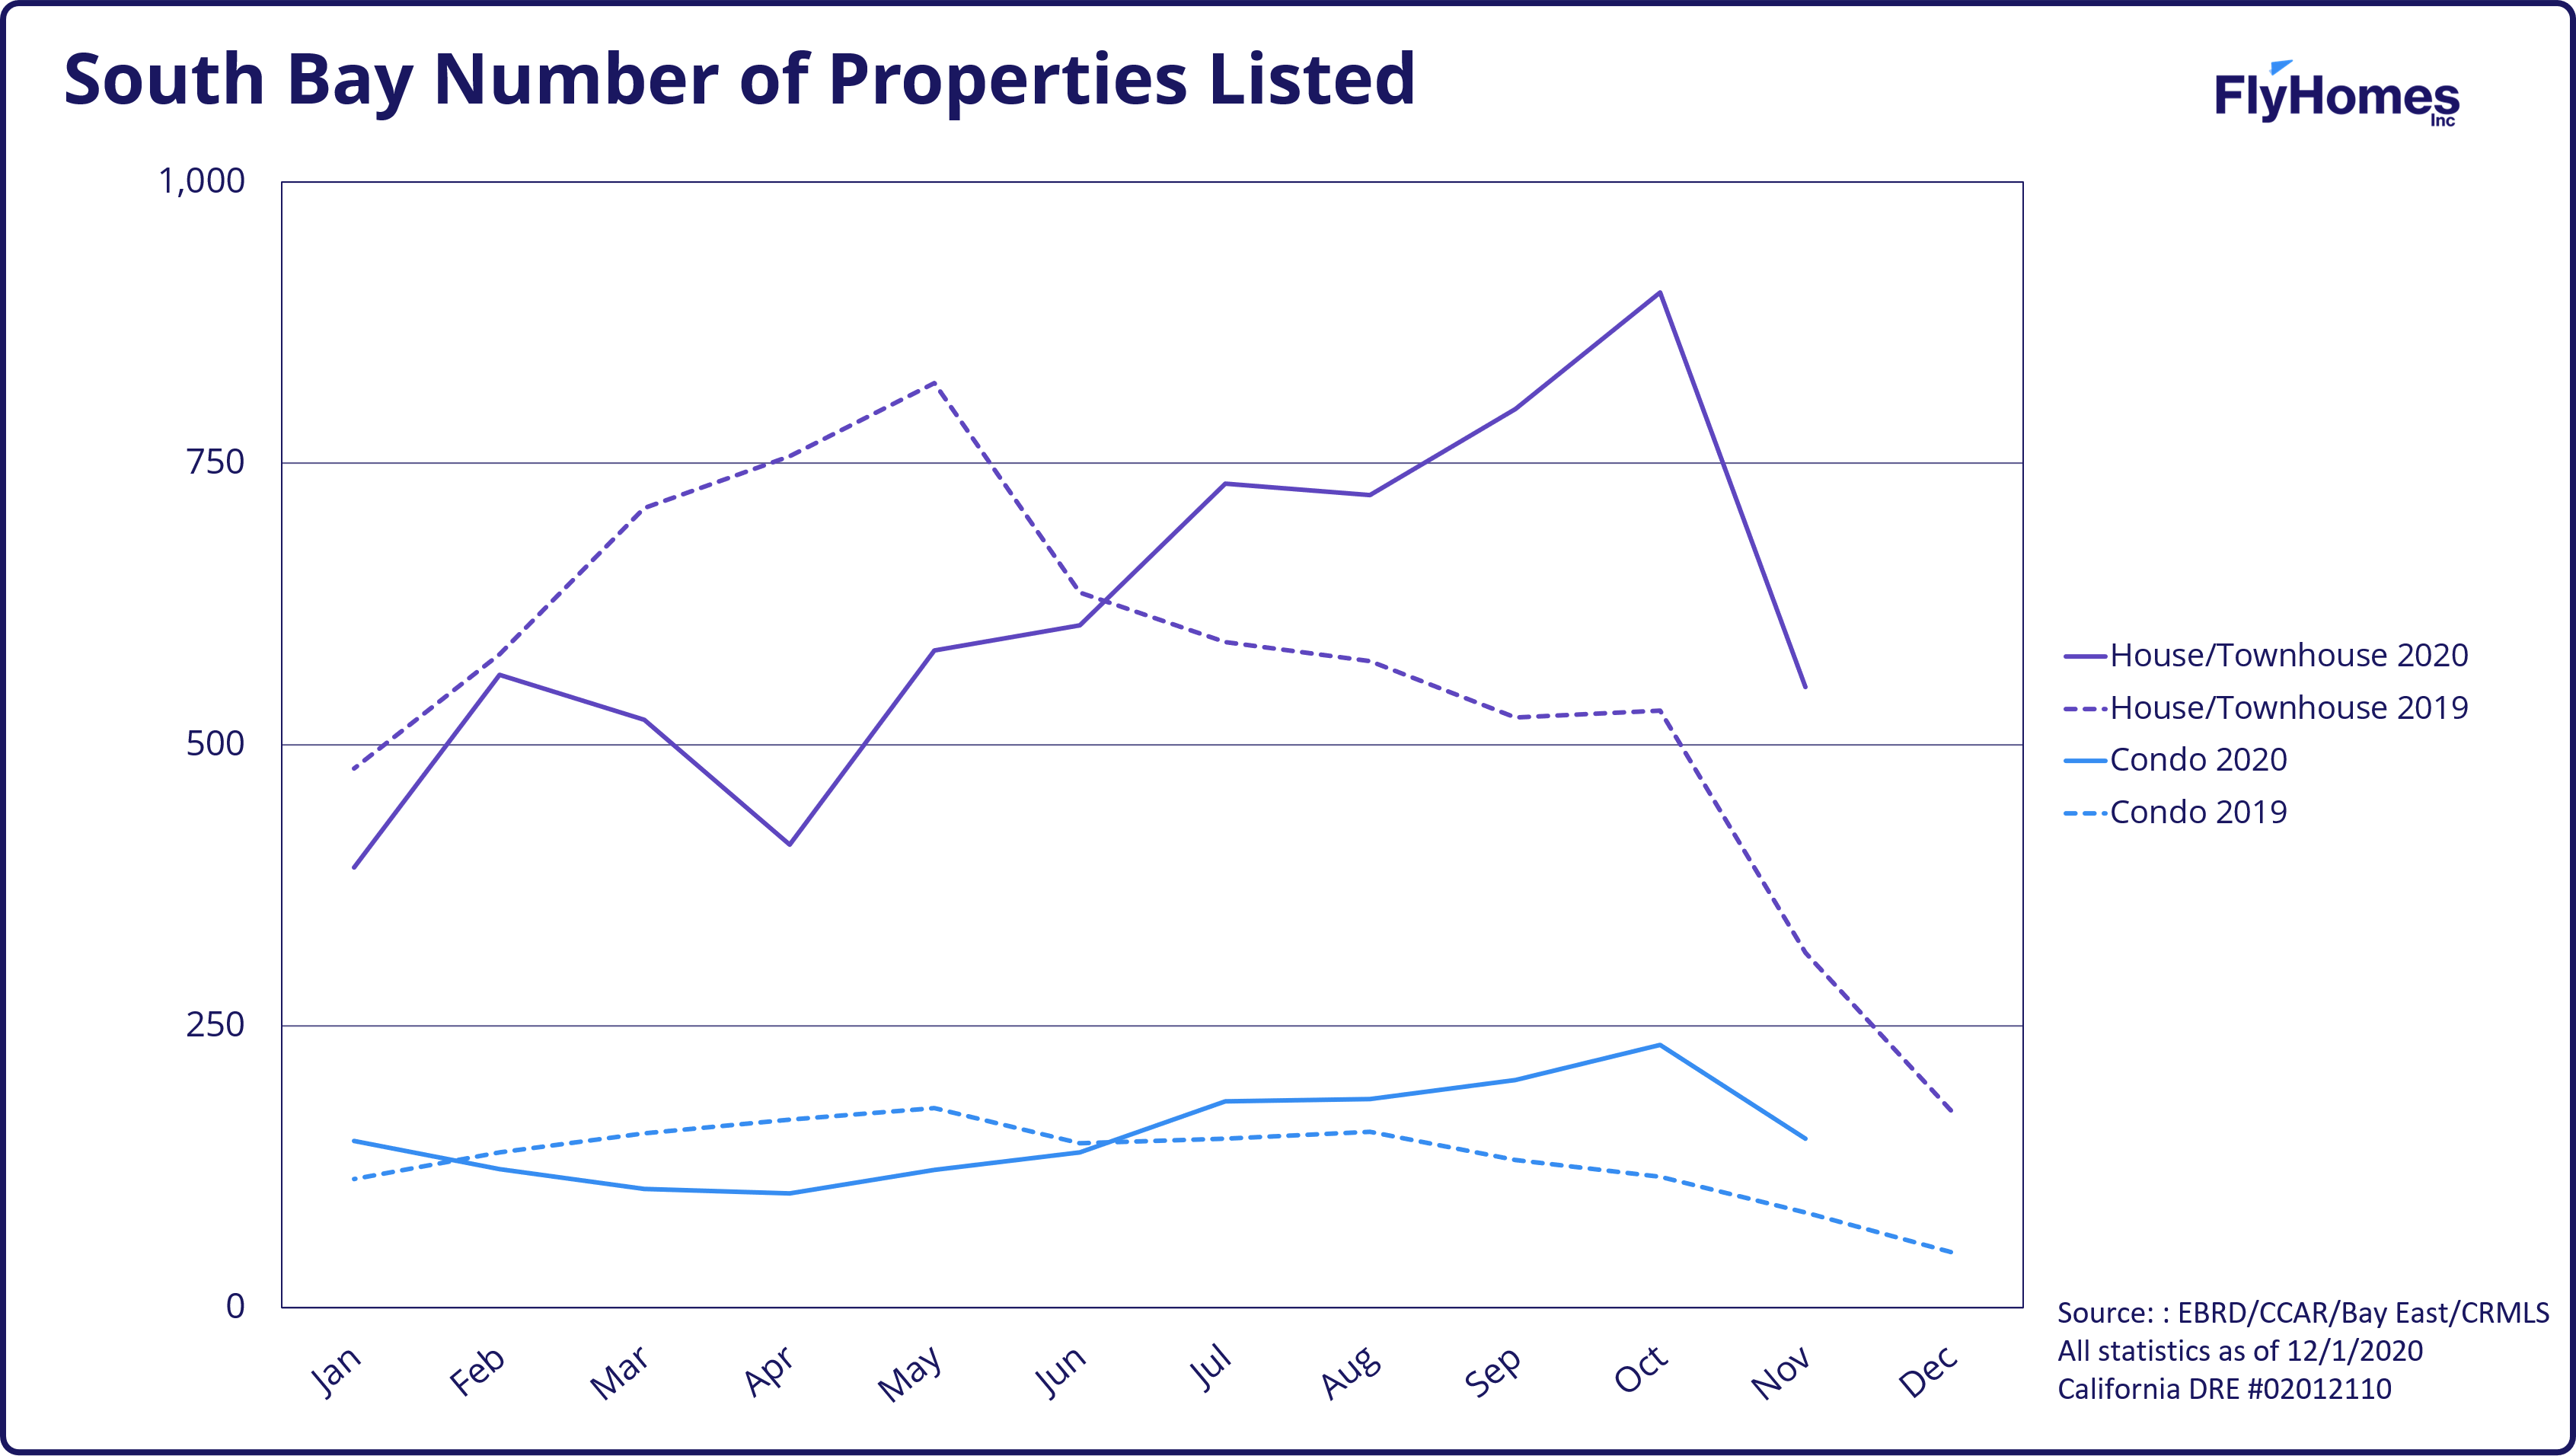
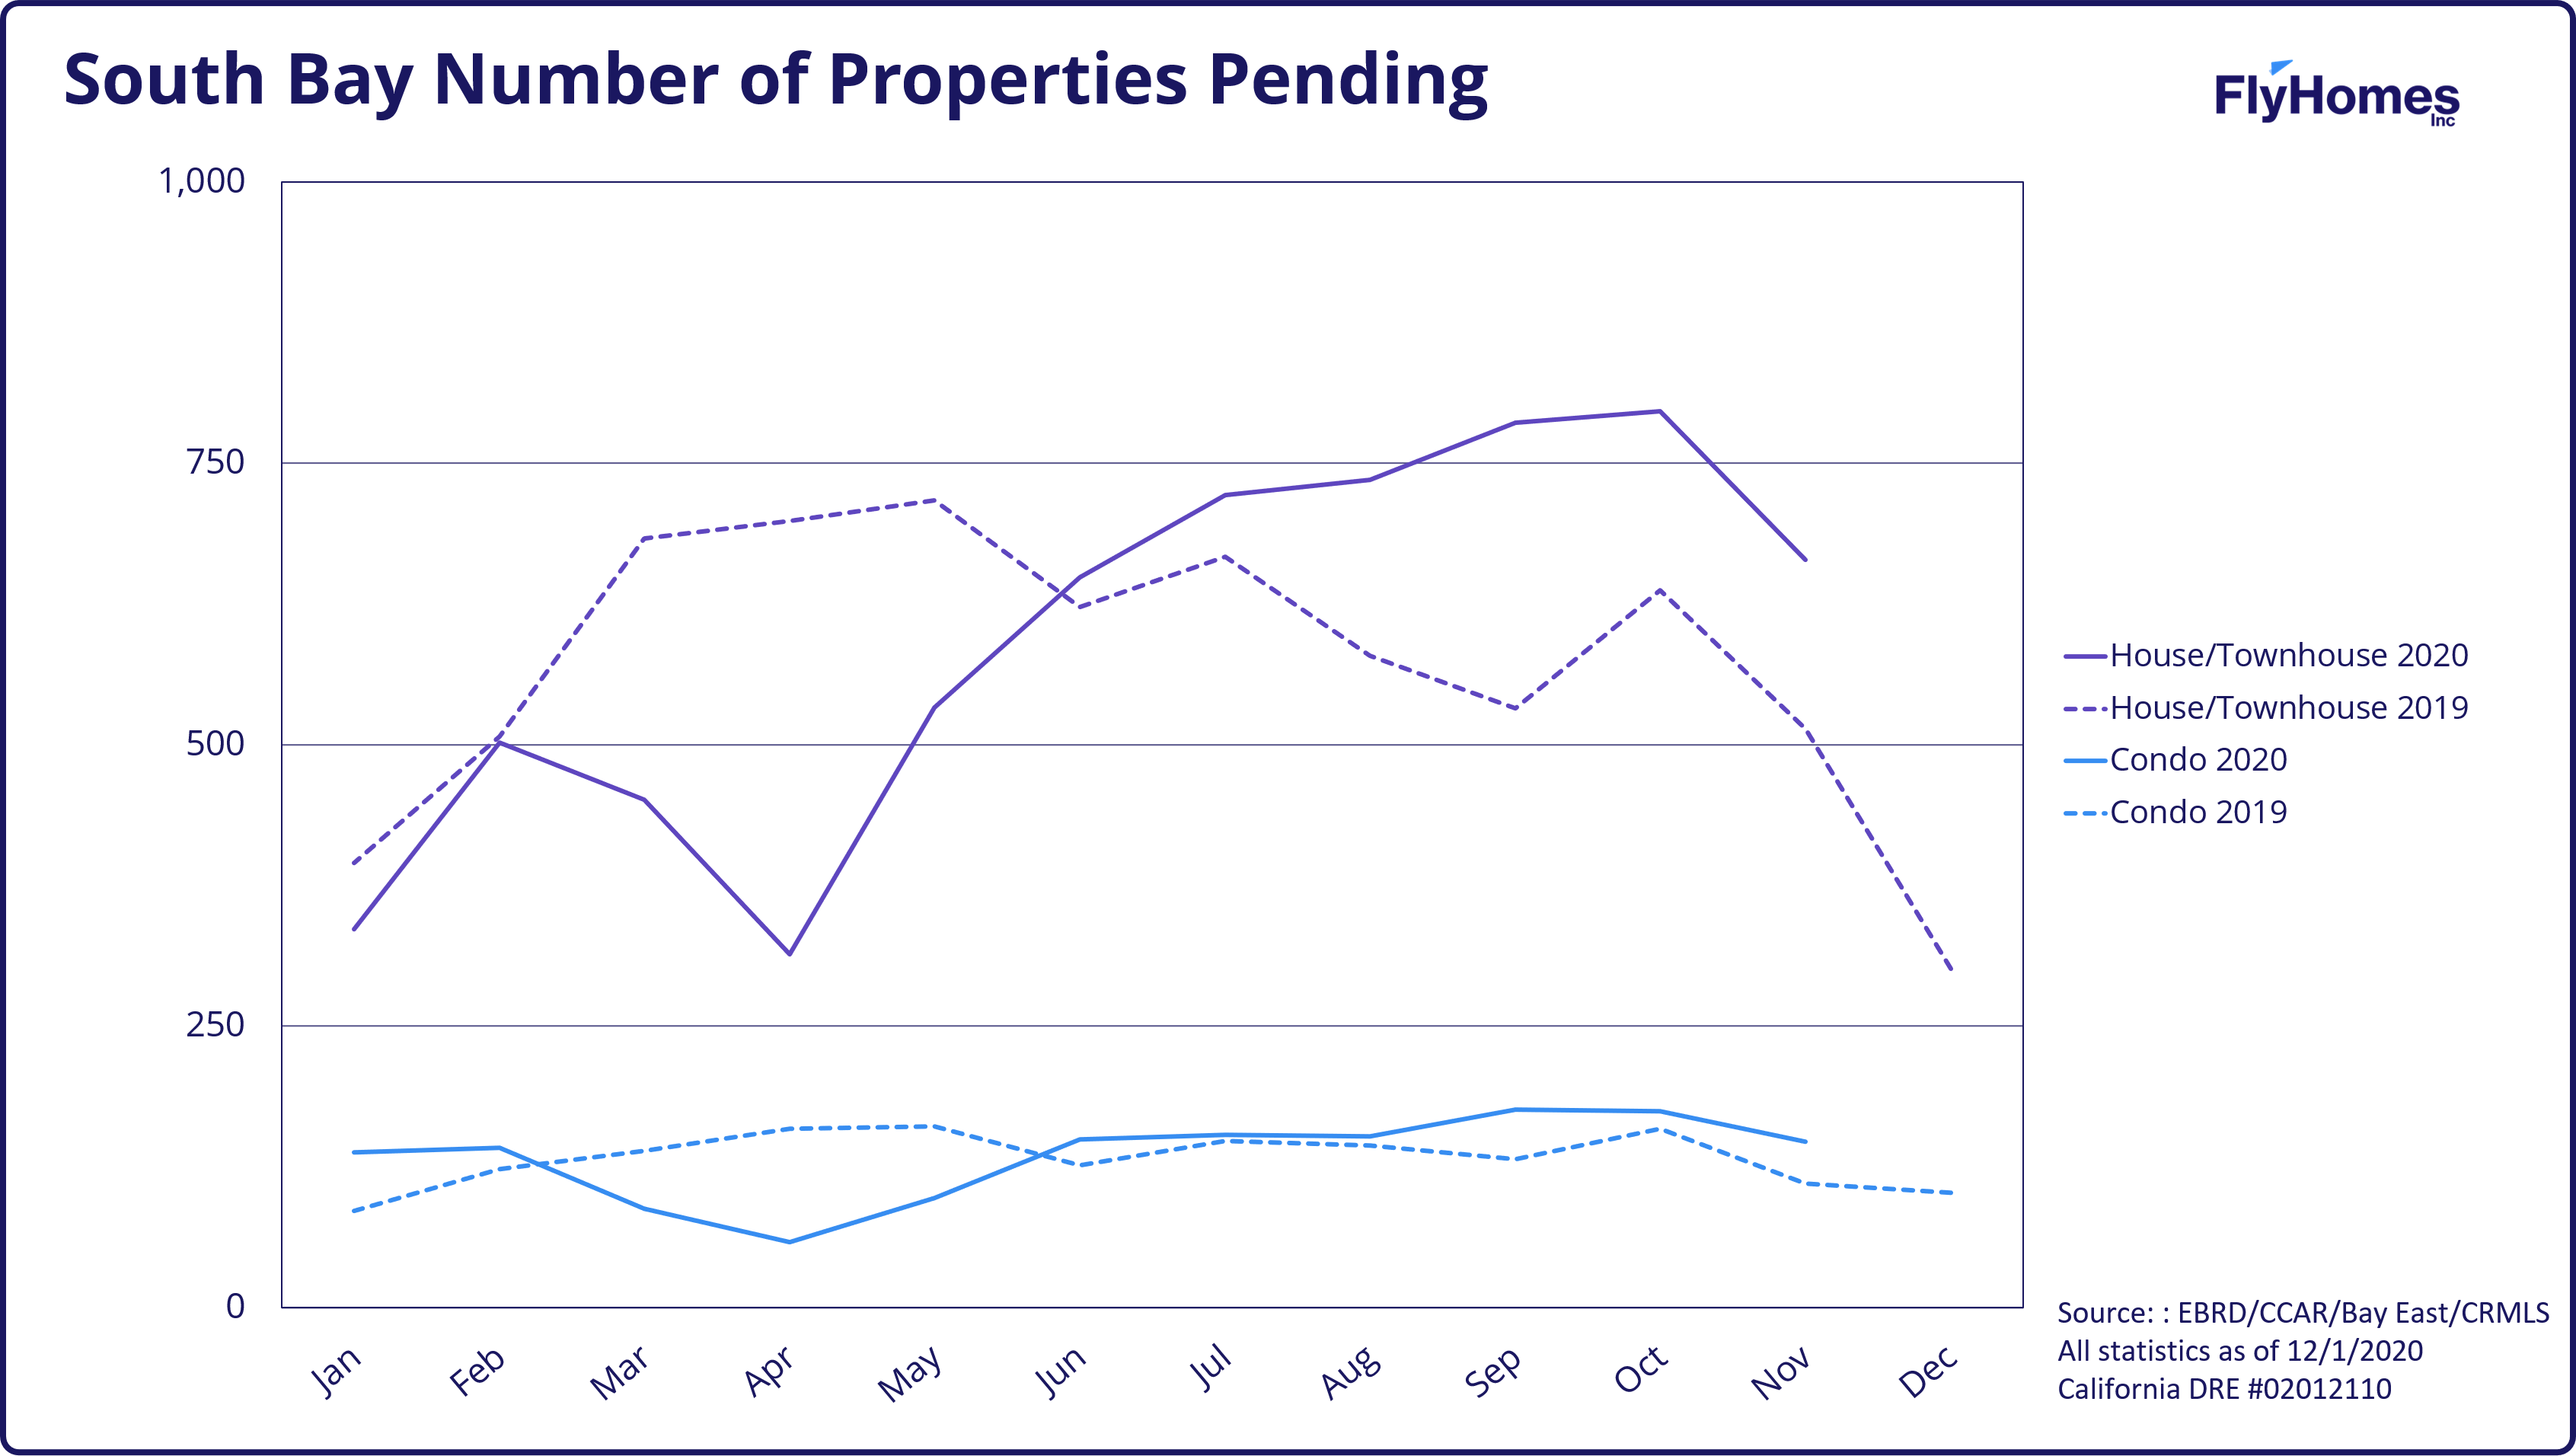
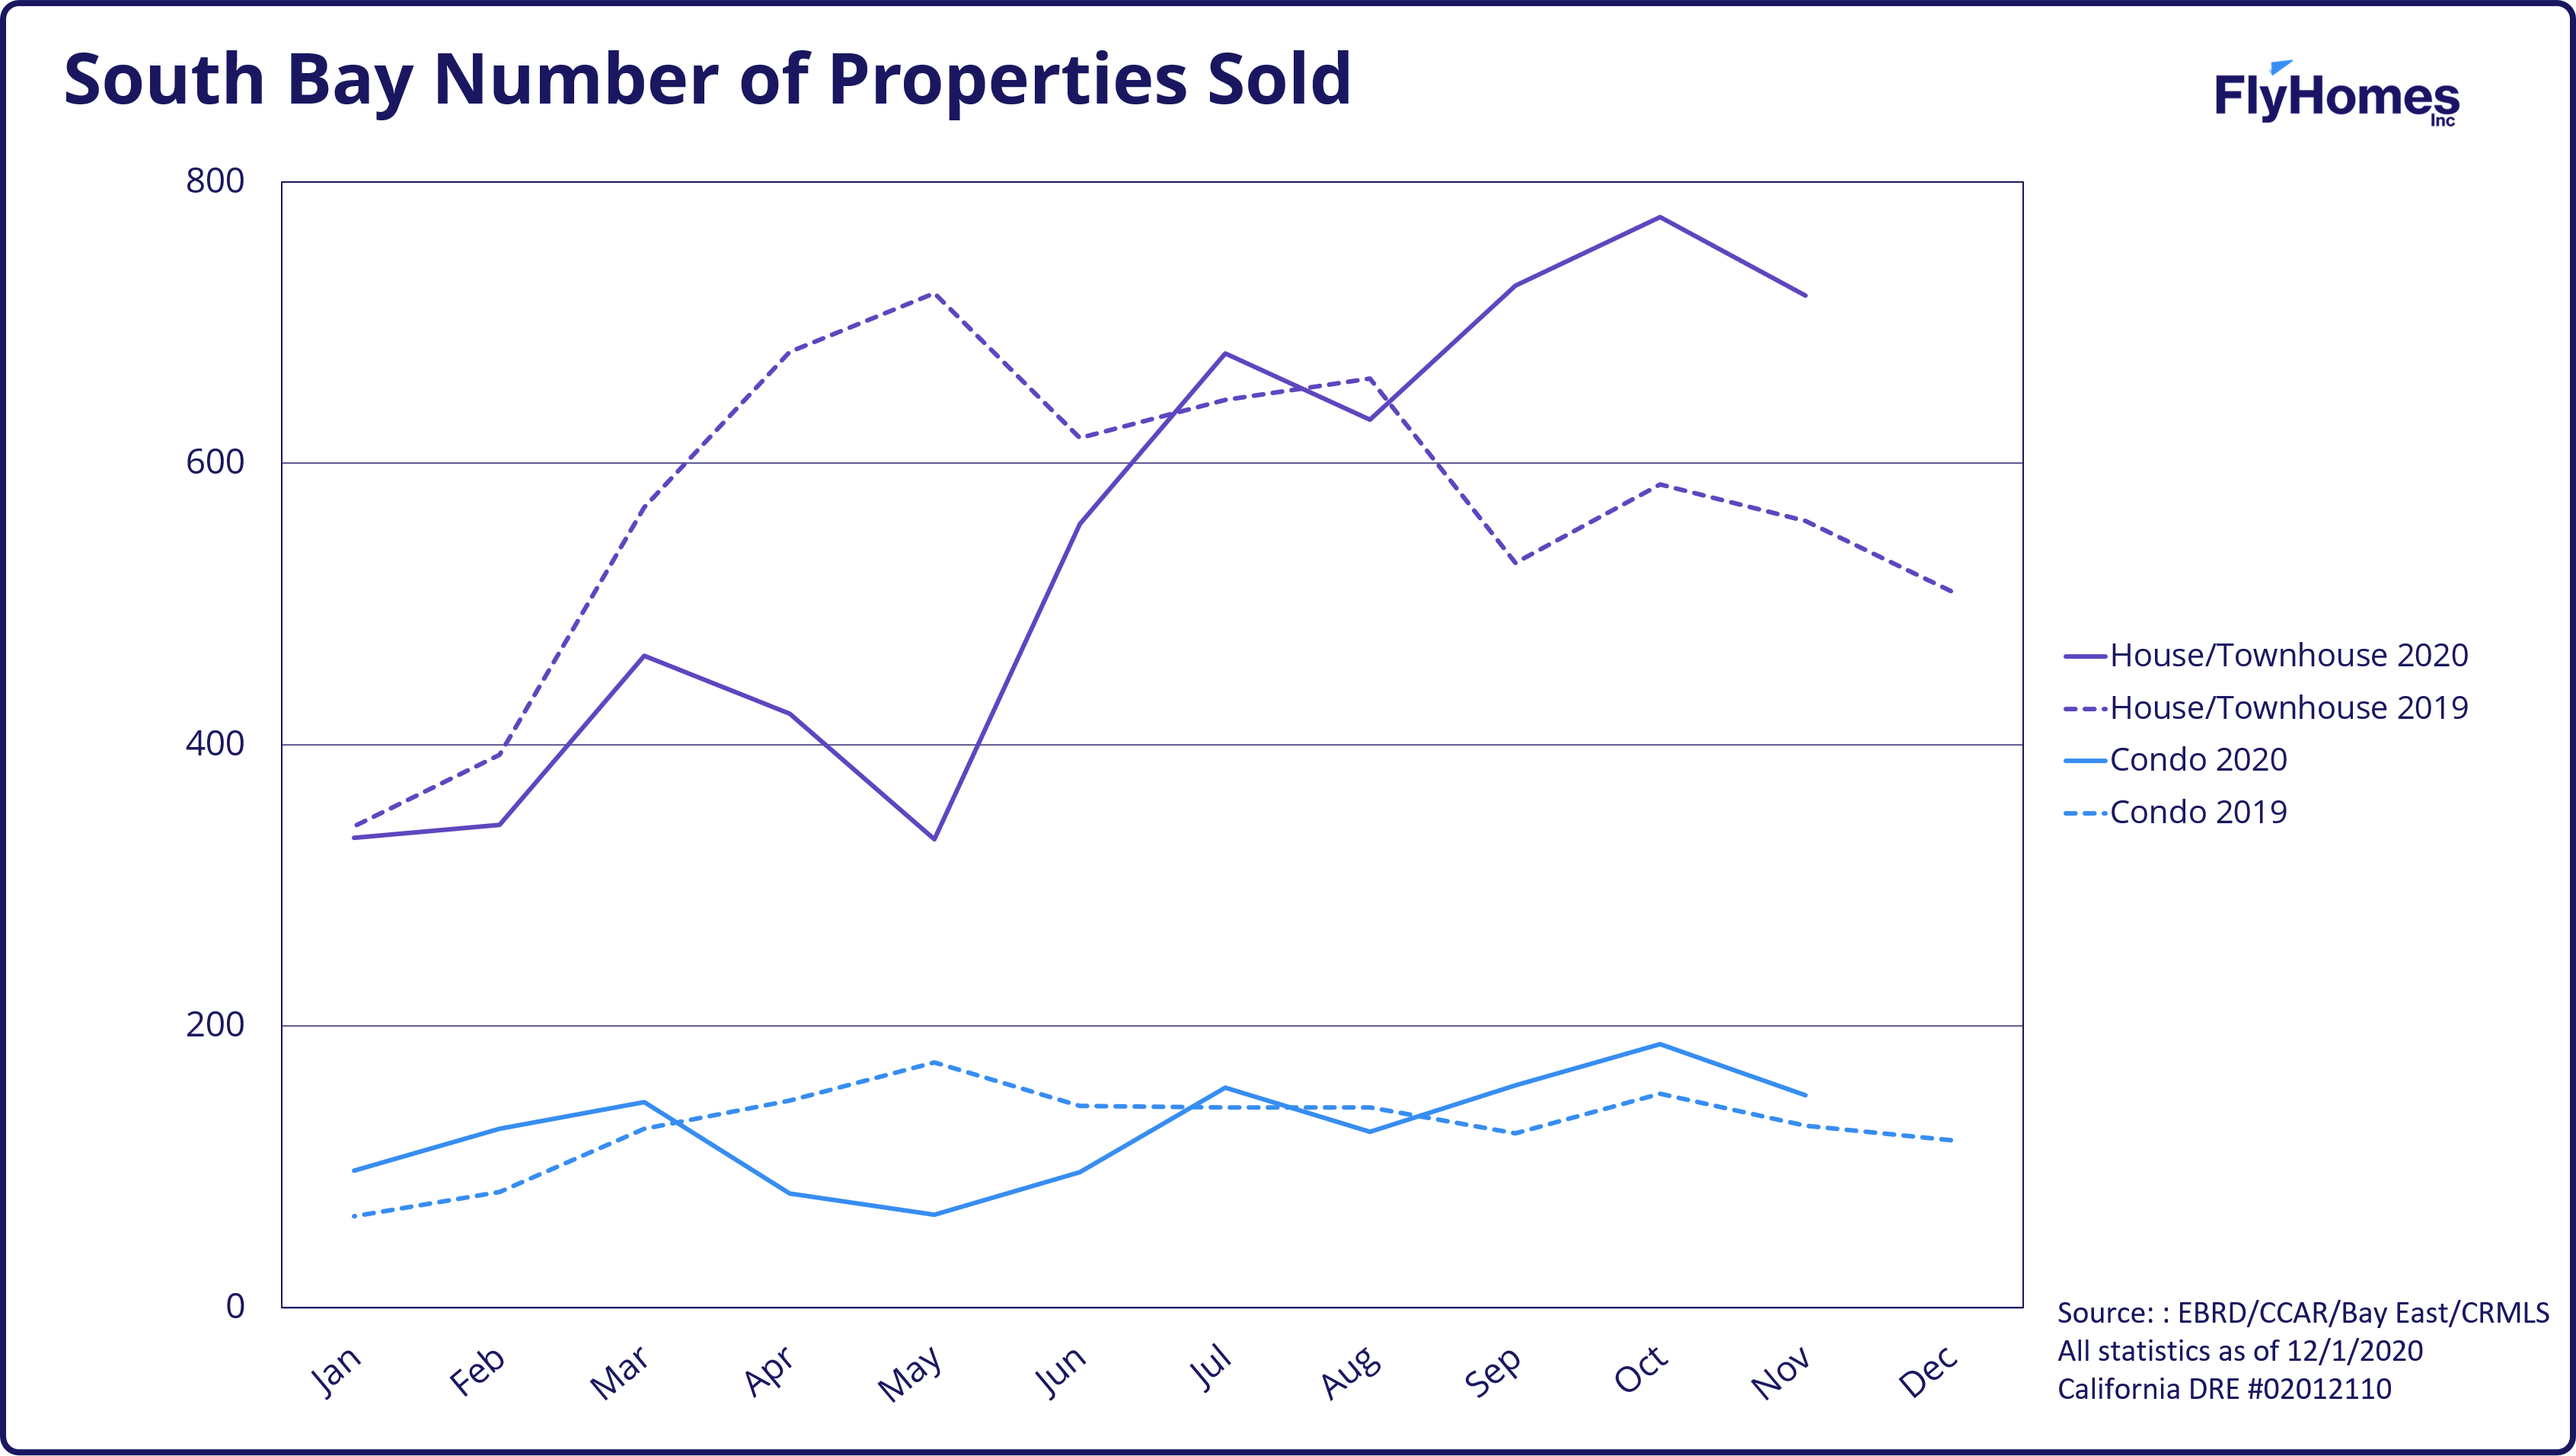
- The South Bay also continues to be active with sale-to-list price ratio up year over year for both single family homes and condos. Single family home sale prices fell slightly, but remain significantly up year over year, as does list price. These higher prices are paired with lower days on market year over year.
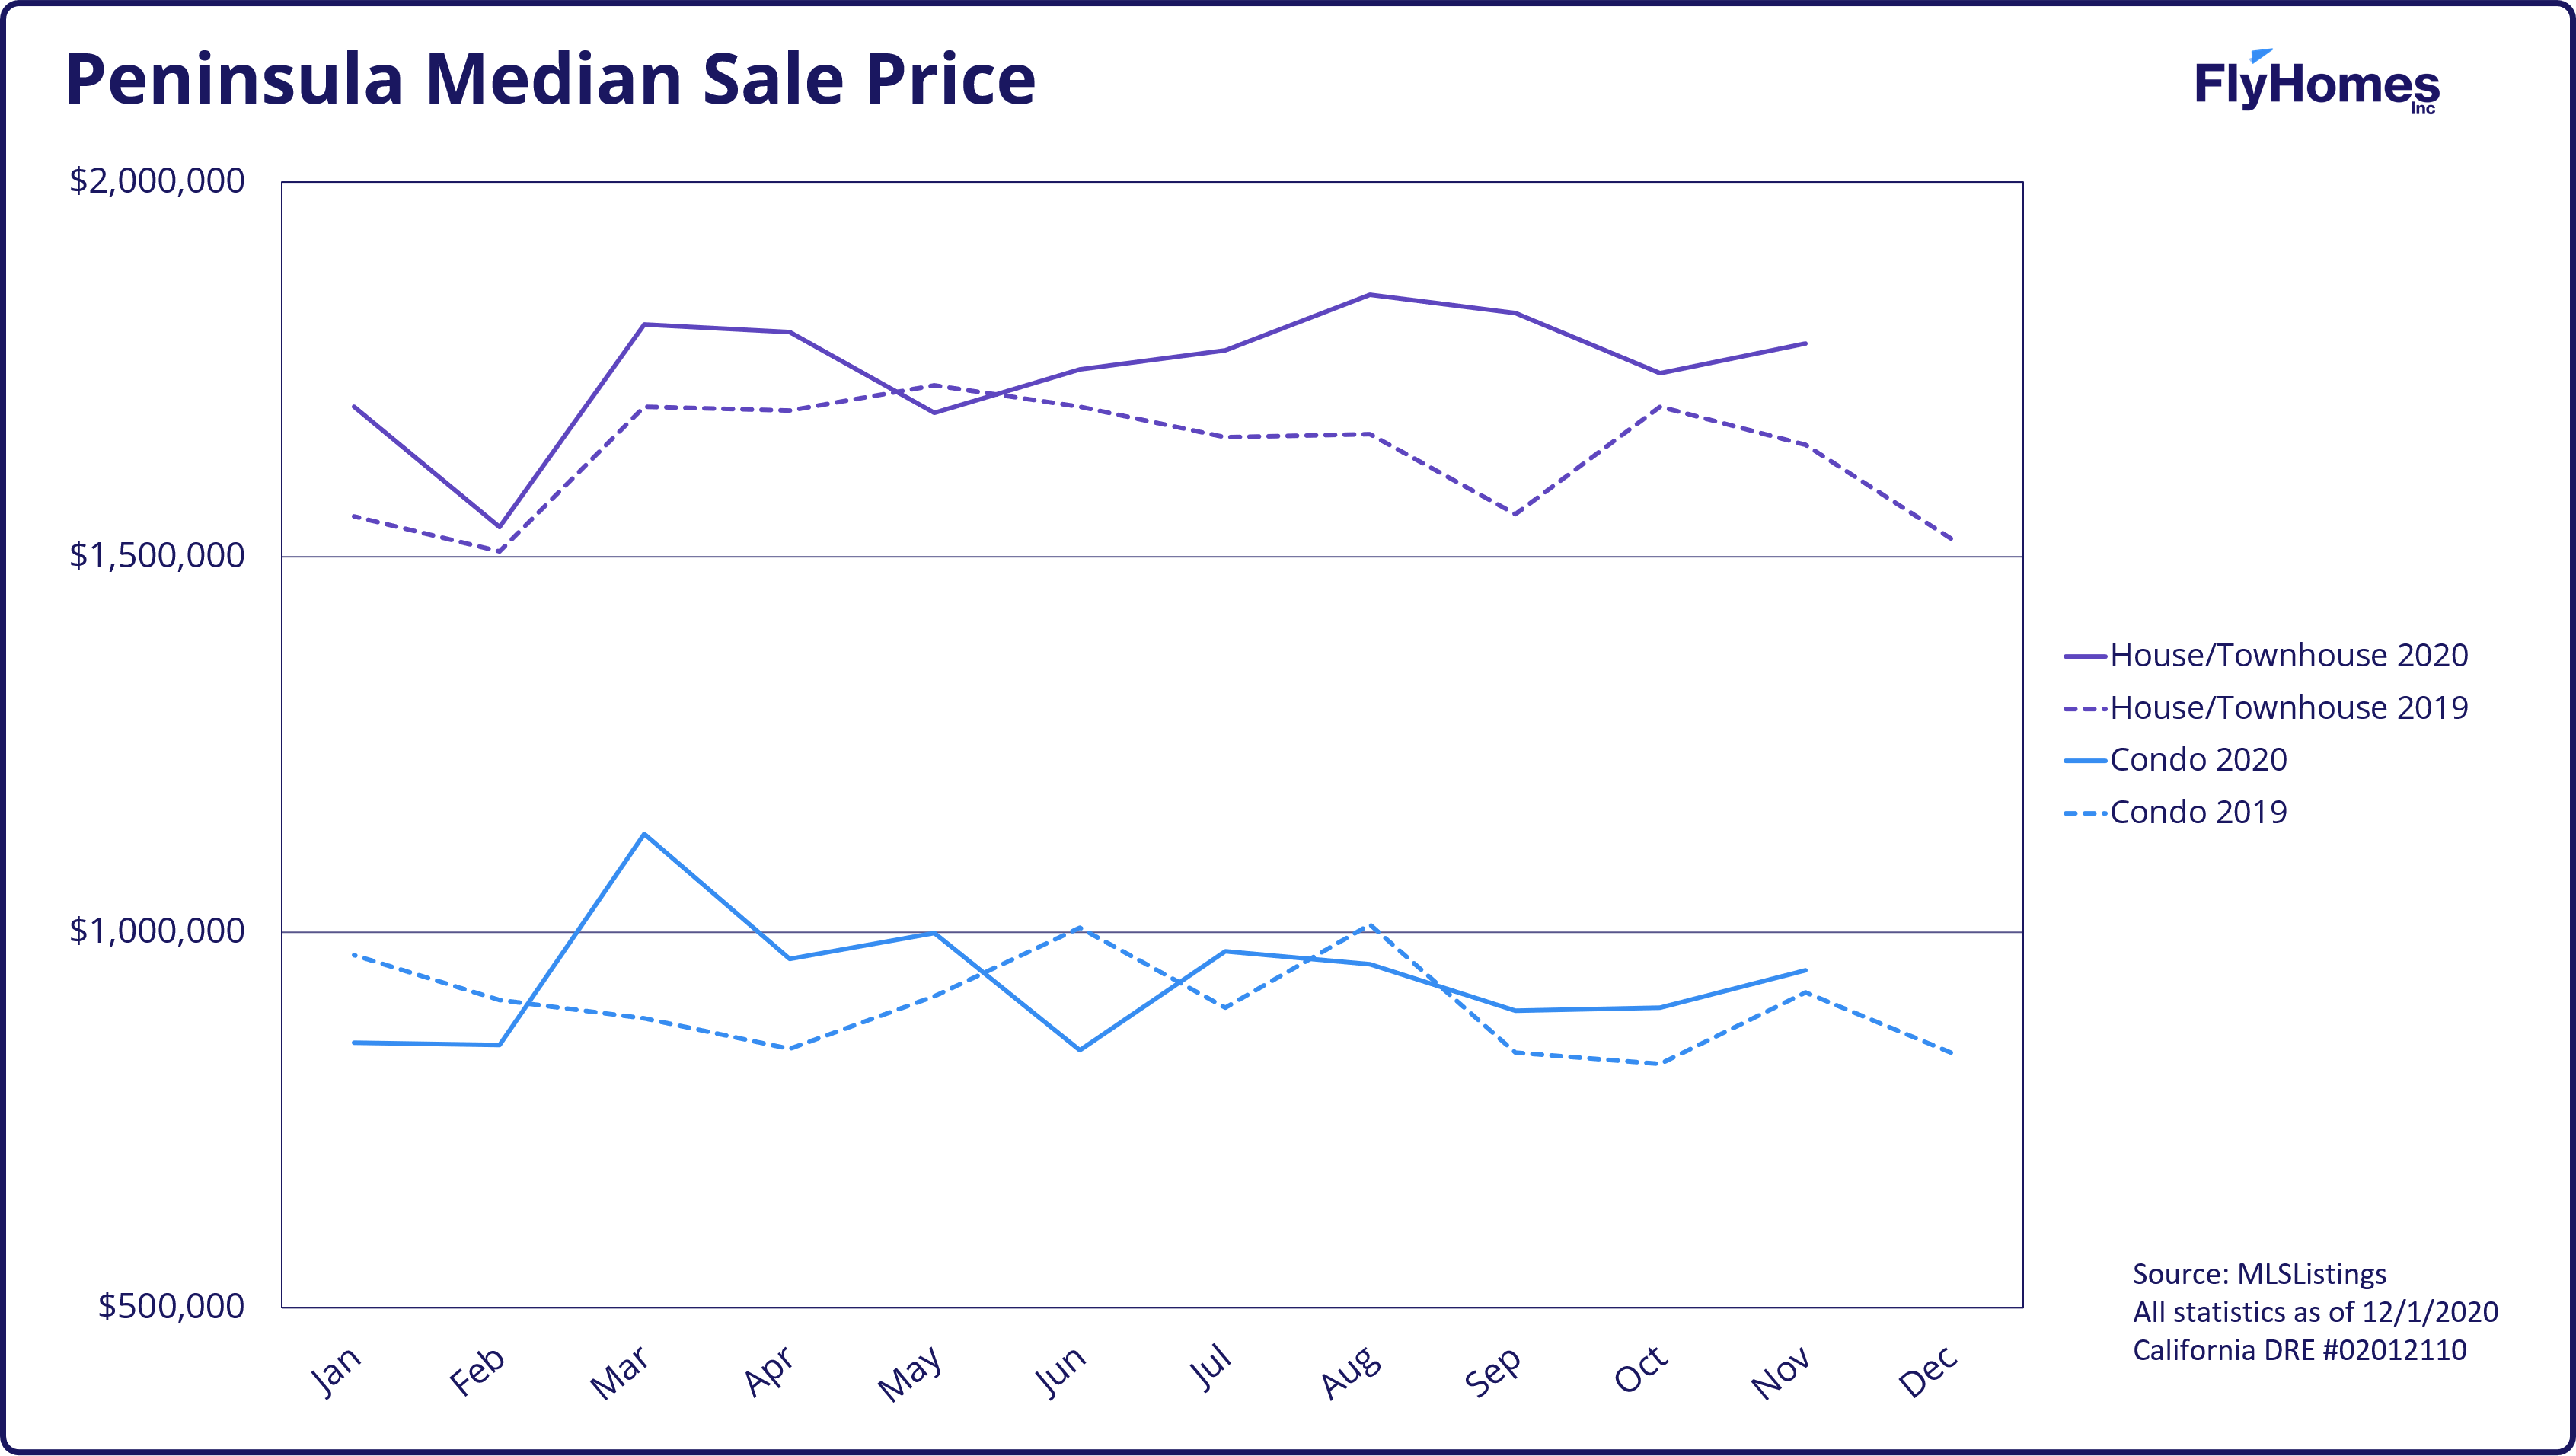
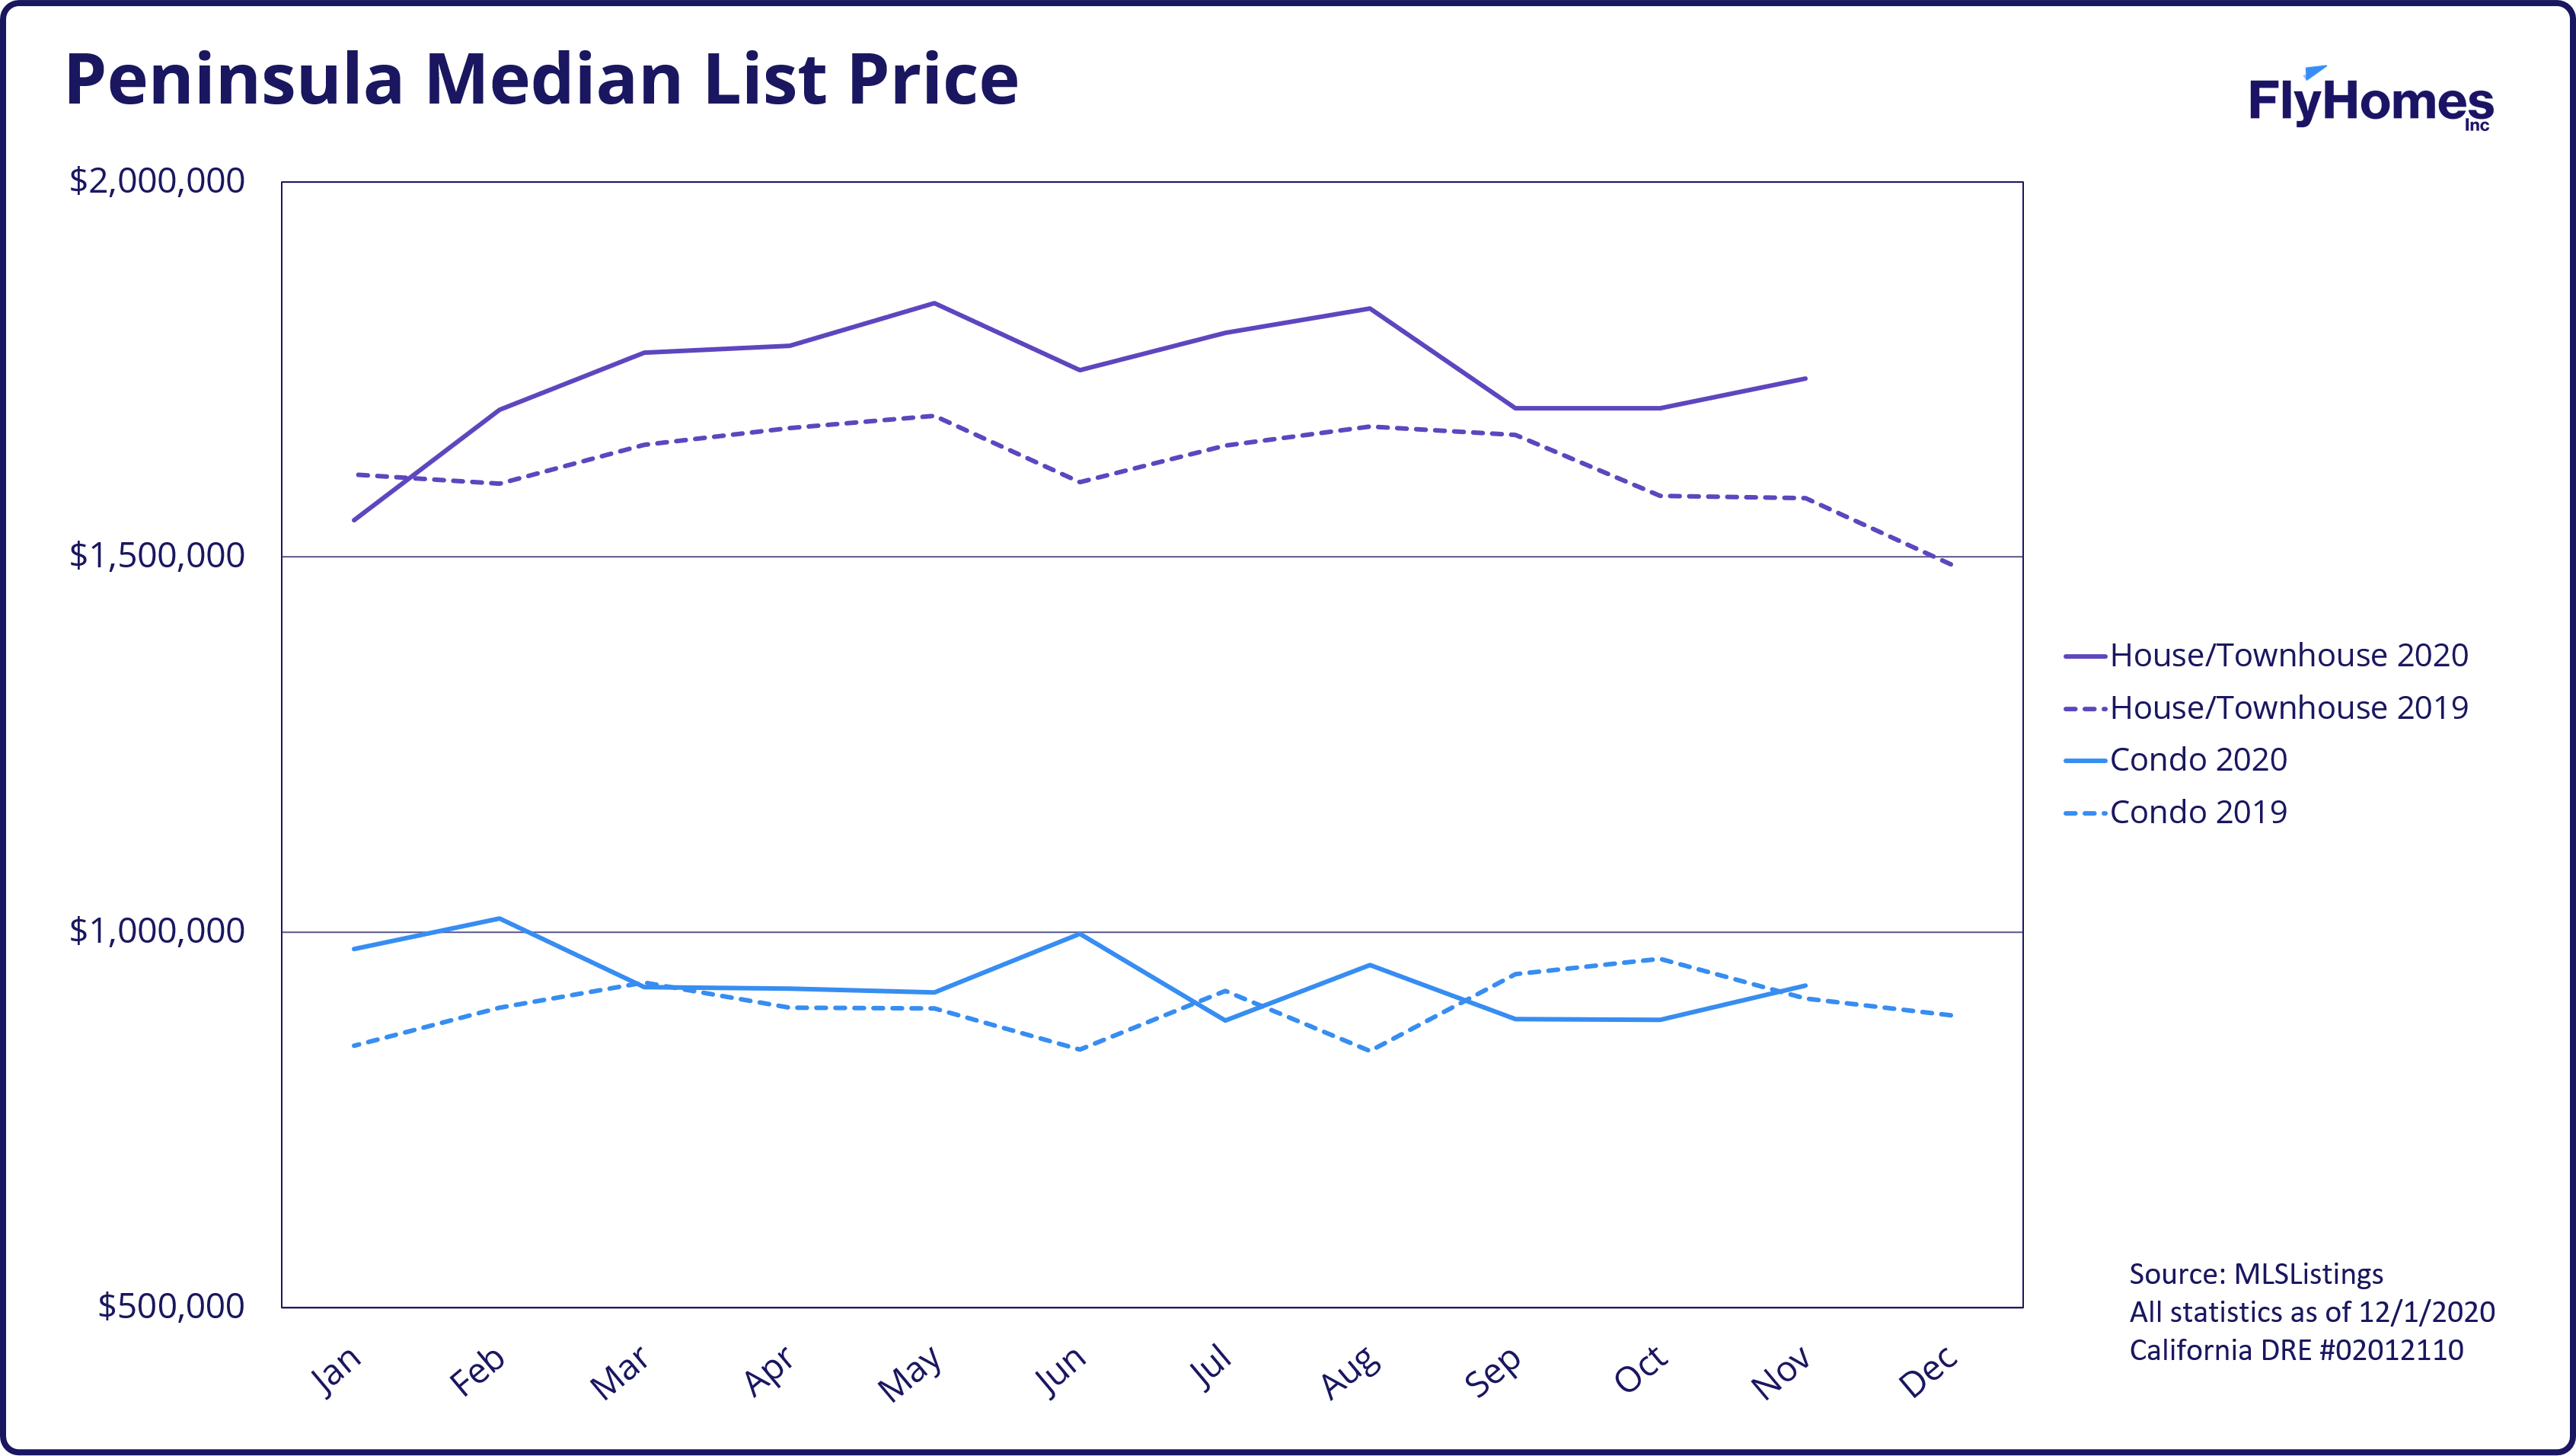
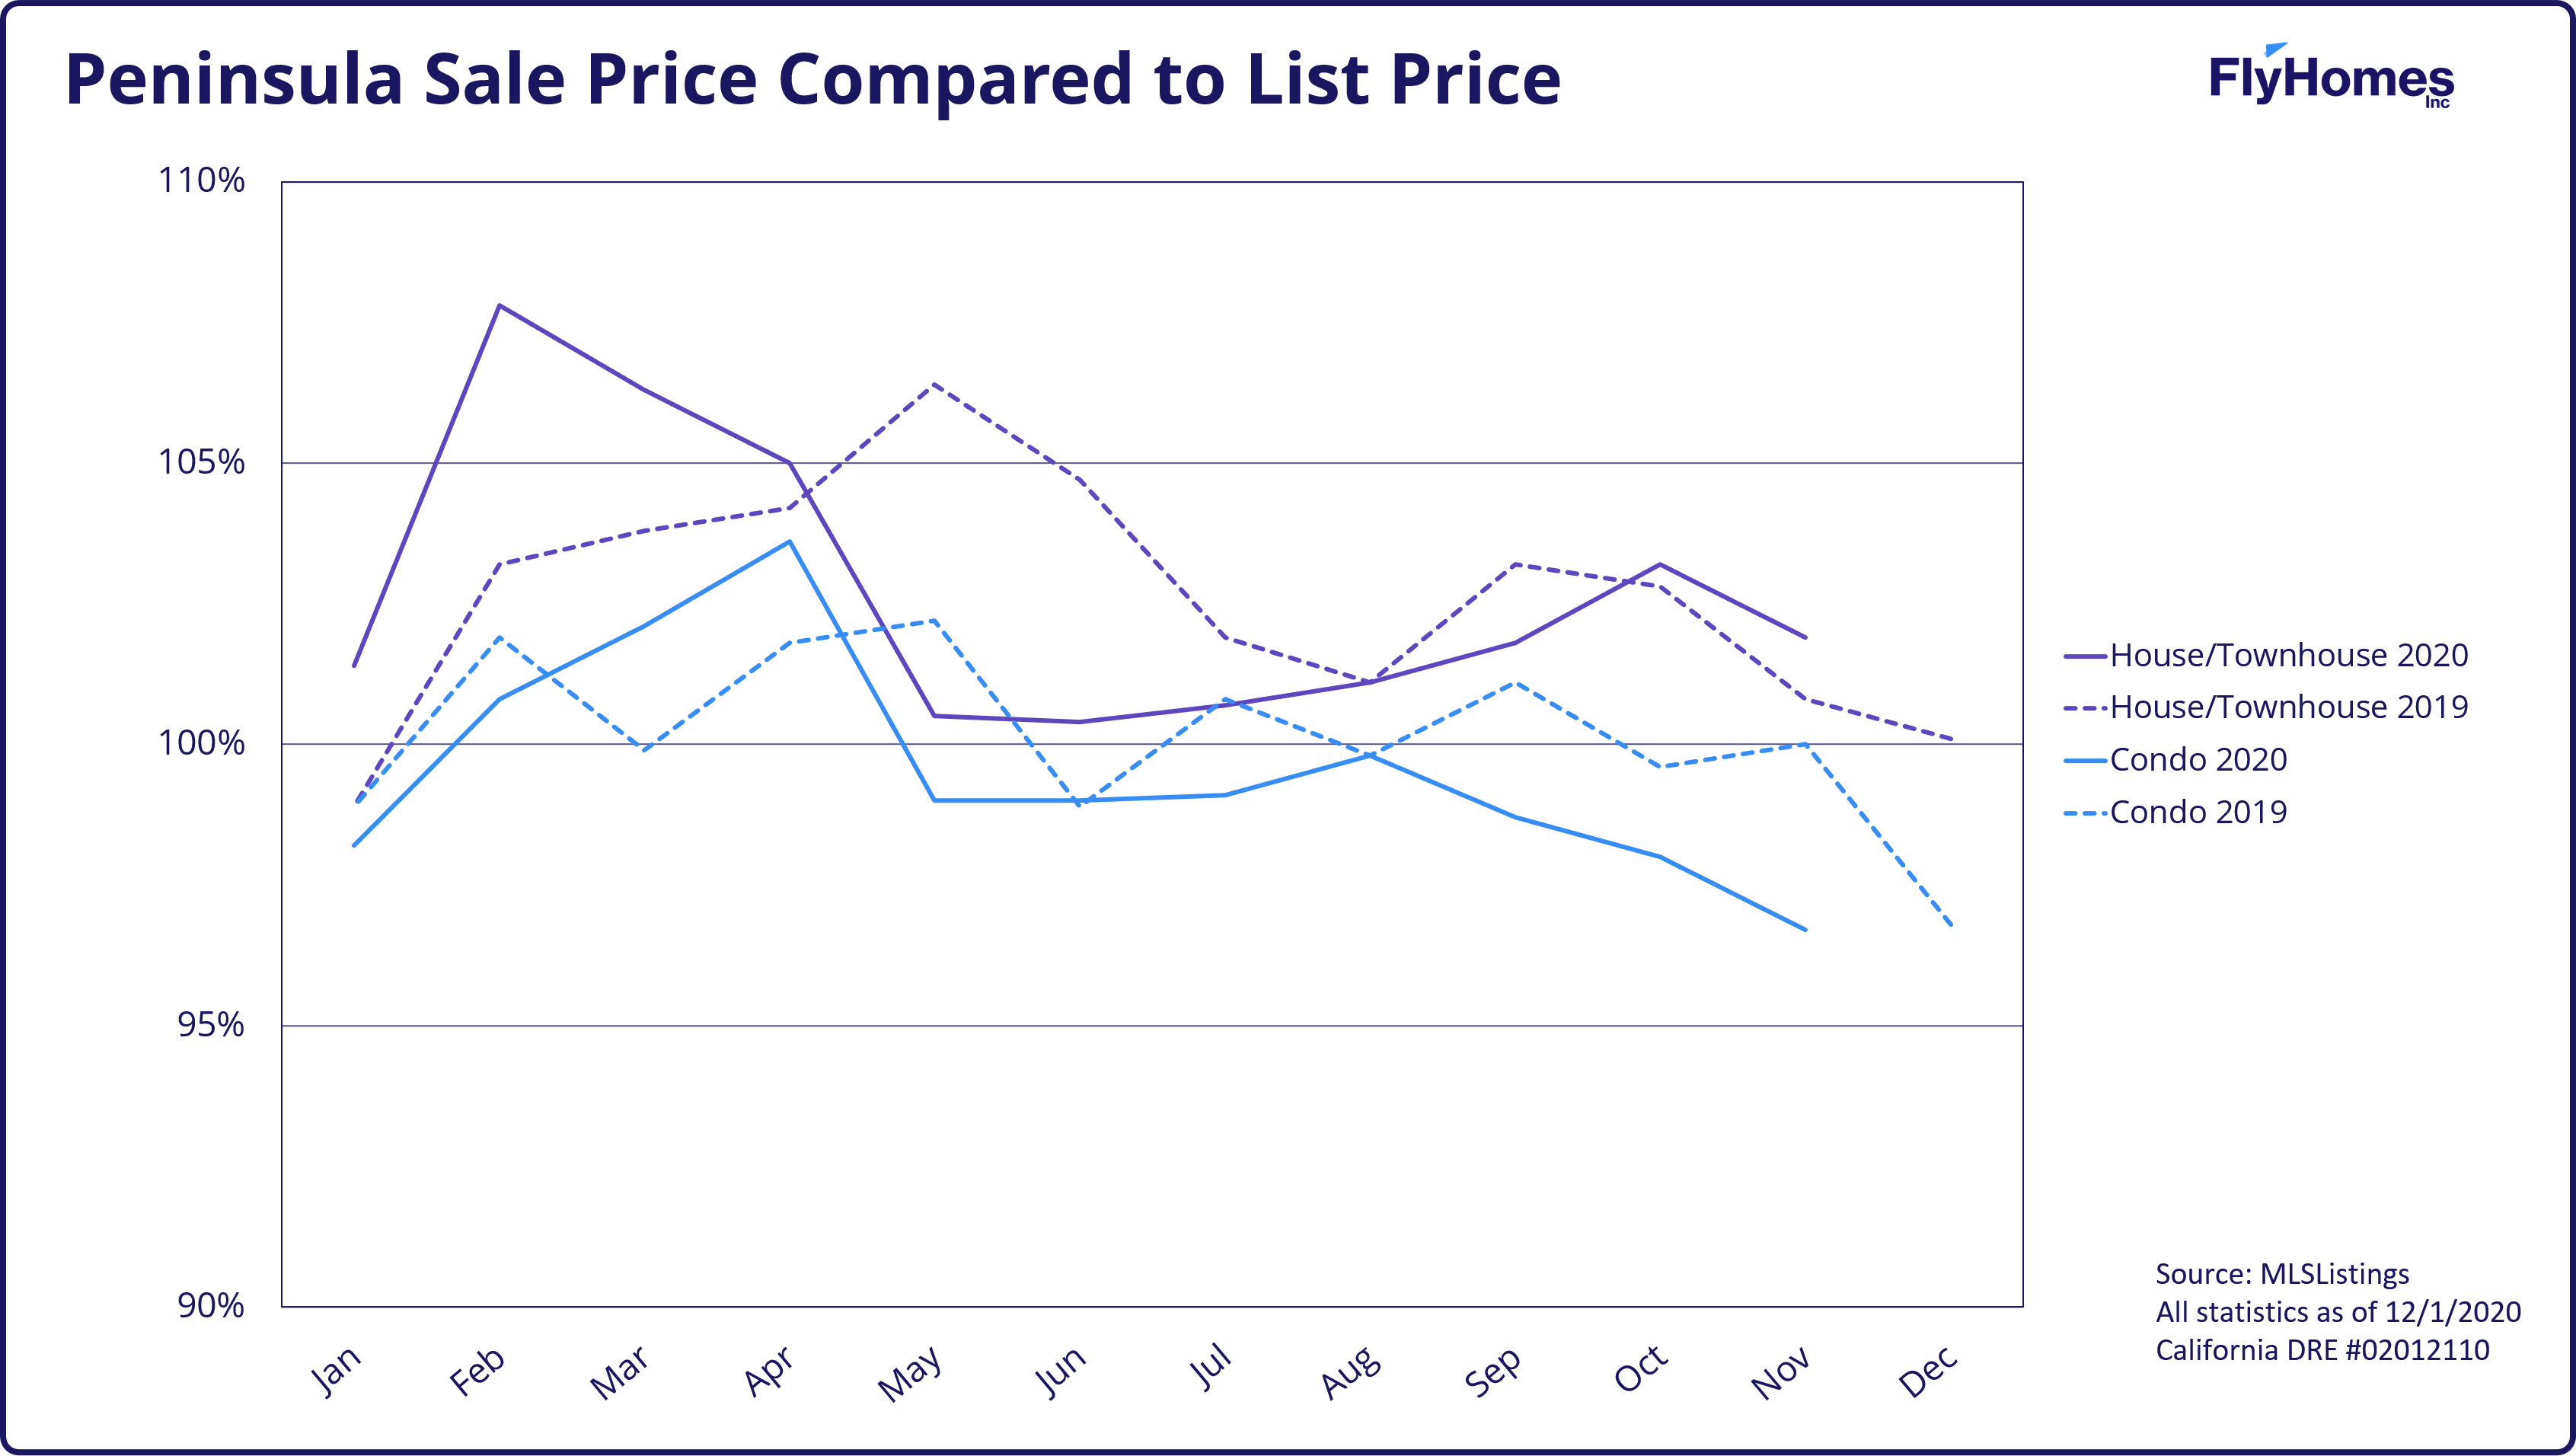
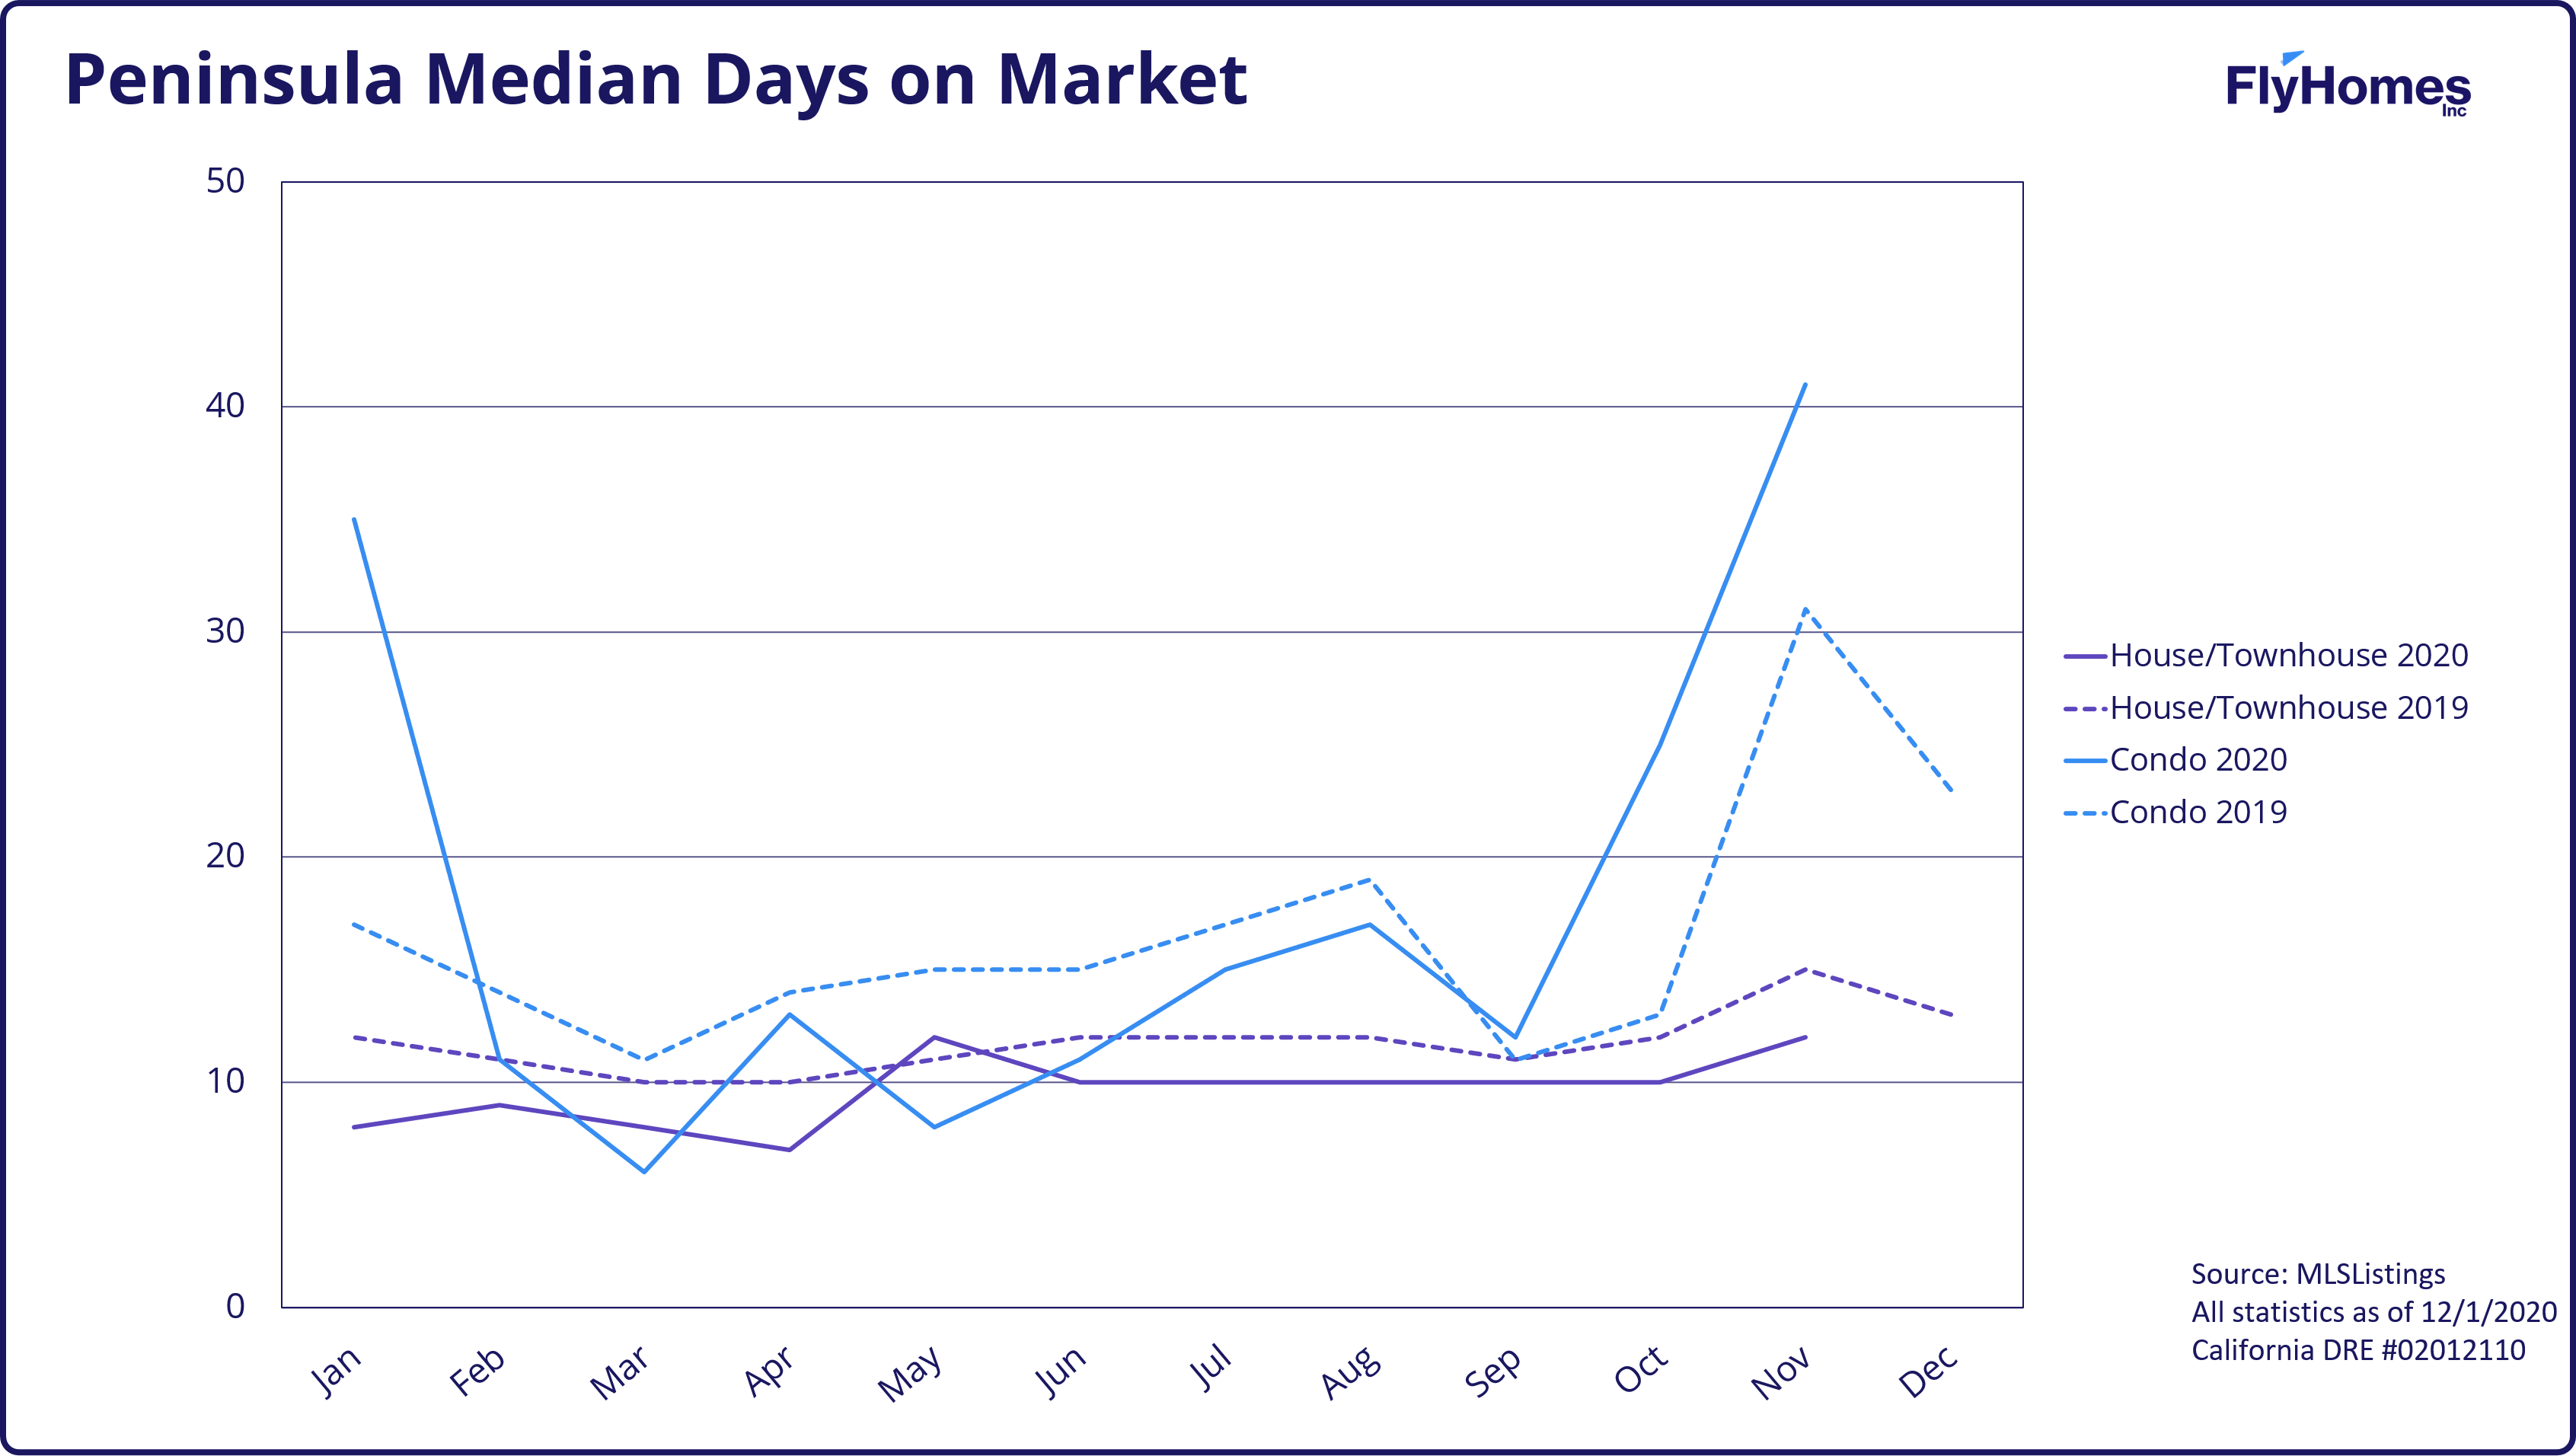
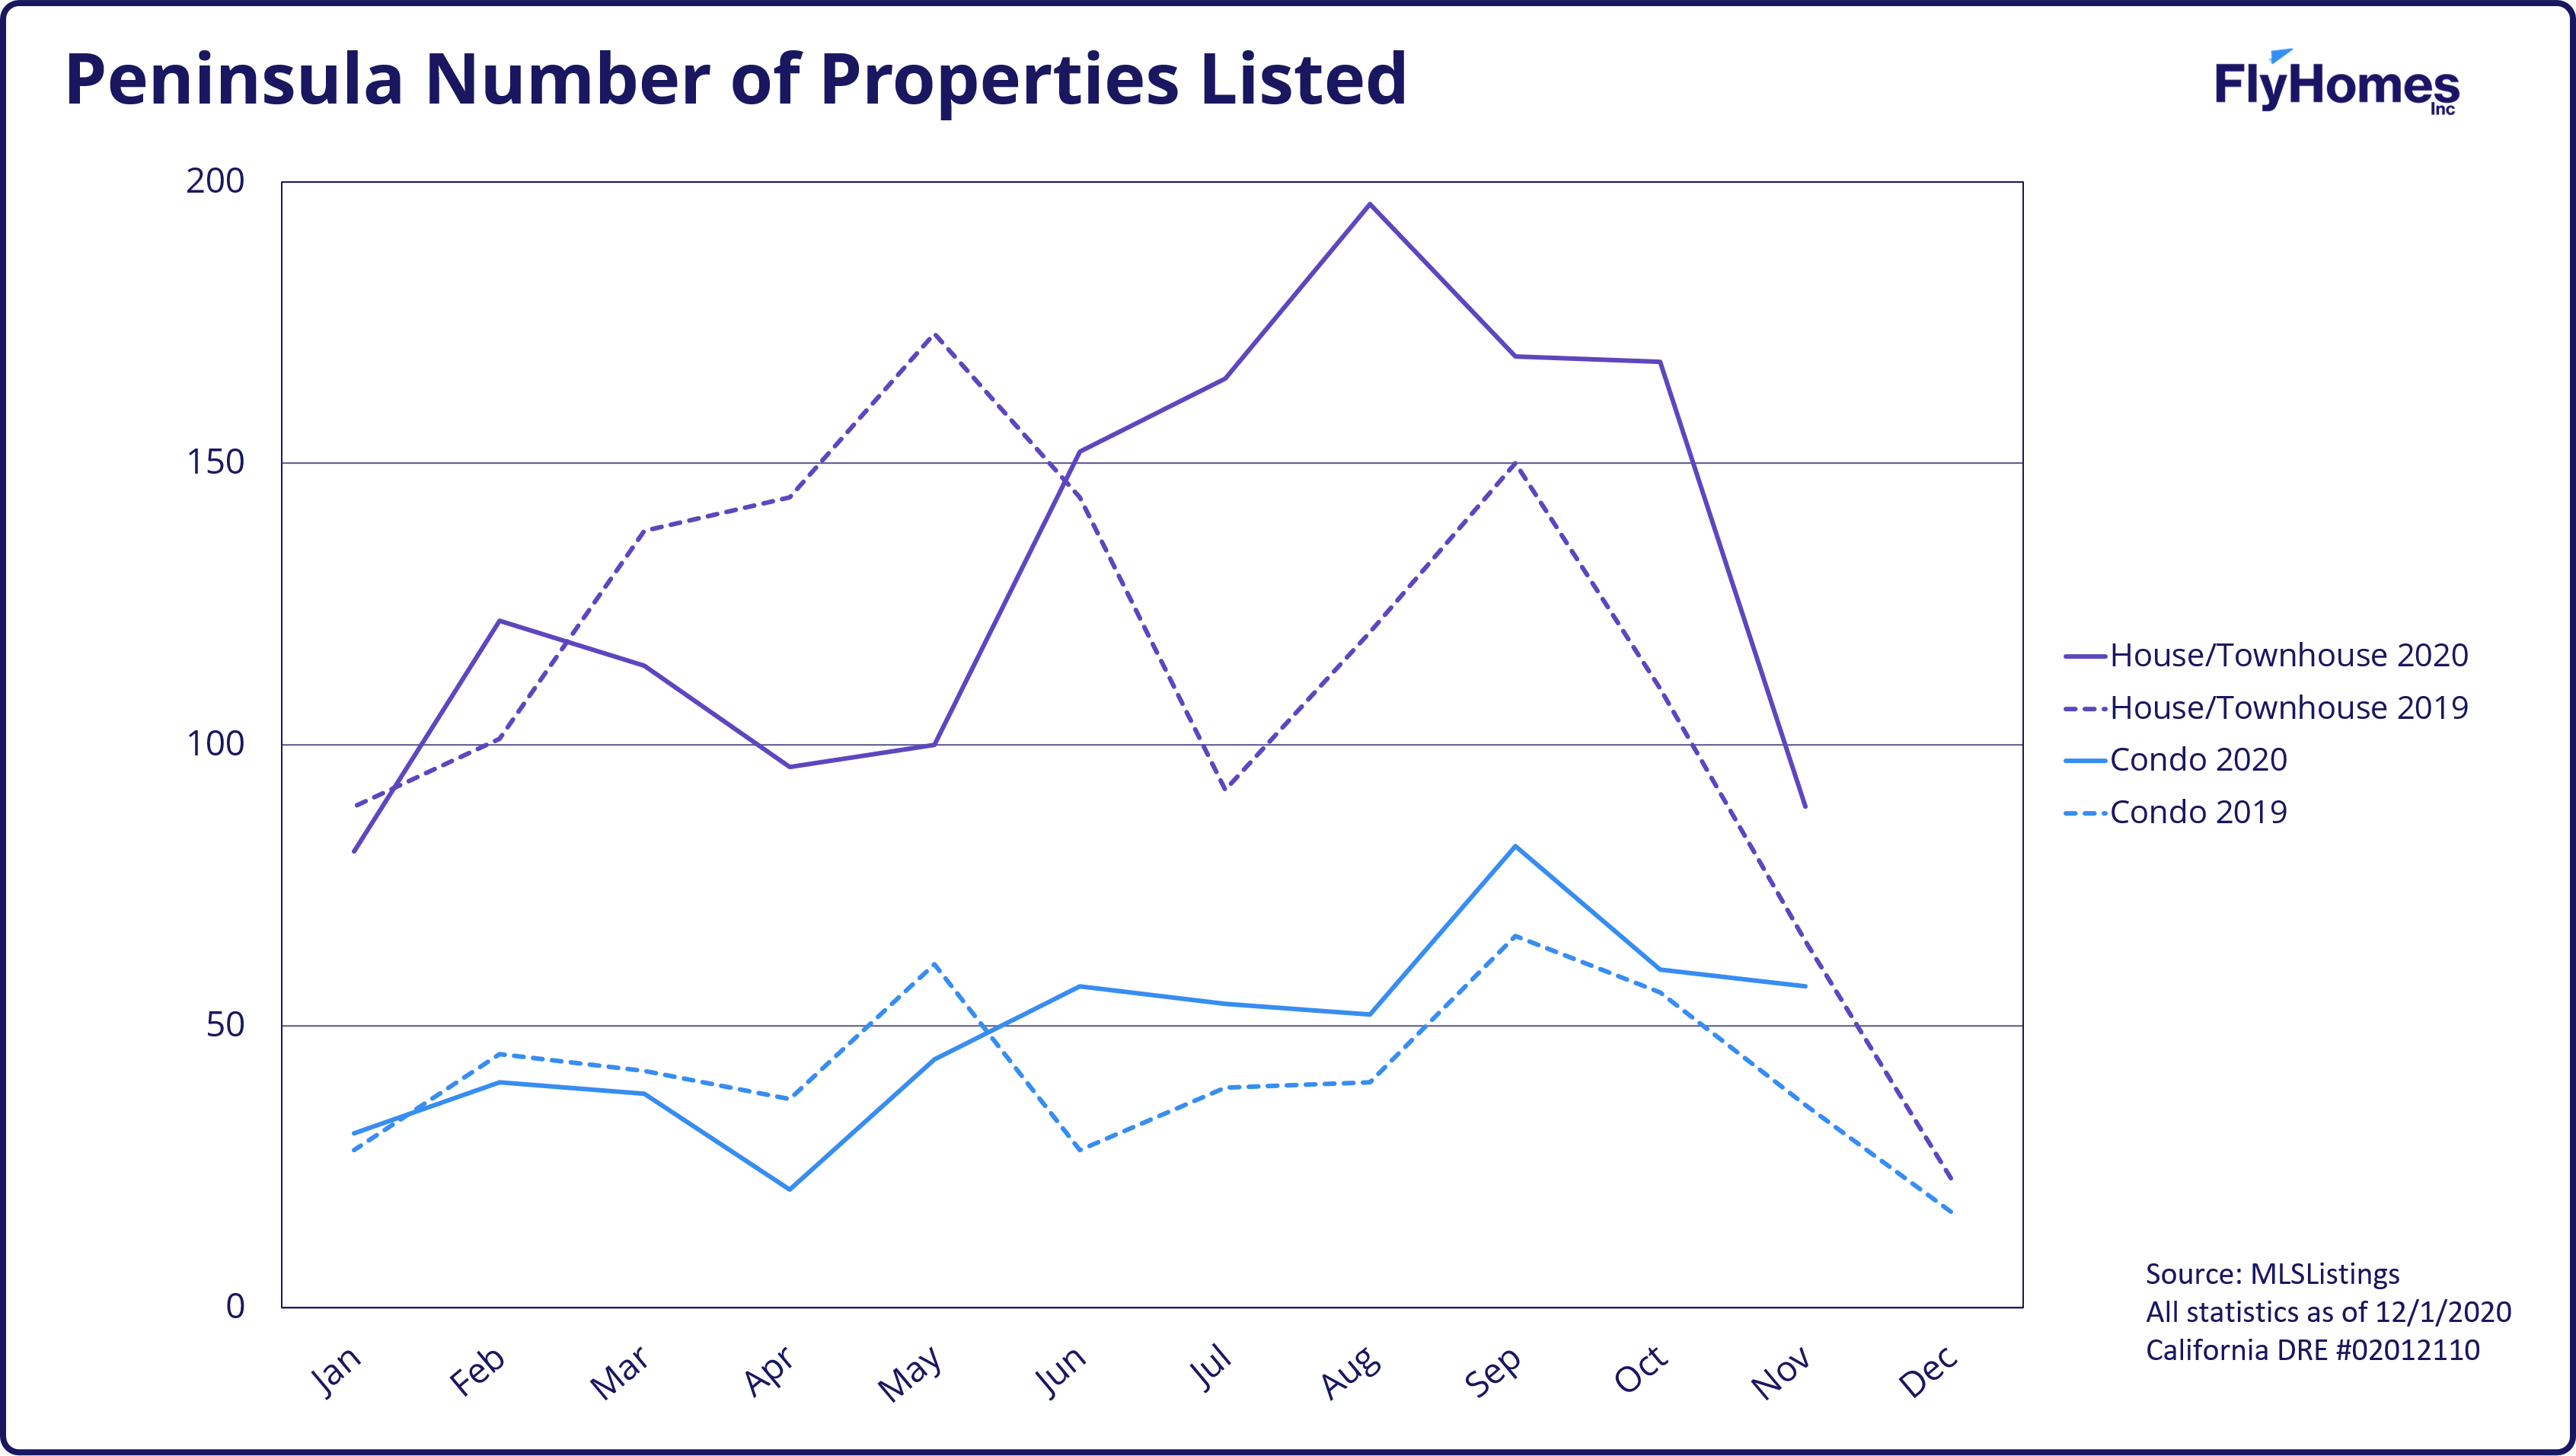
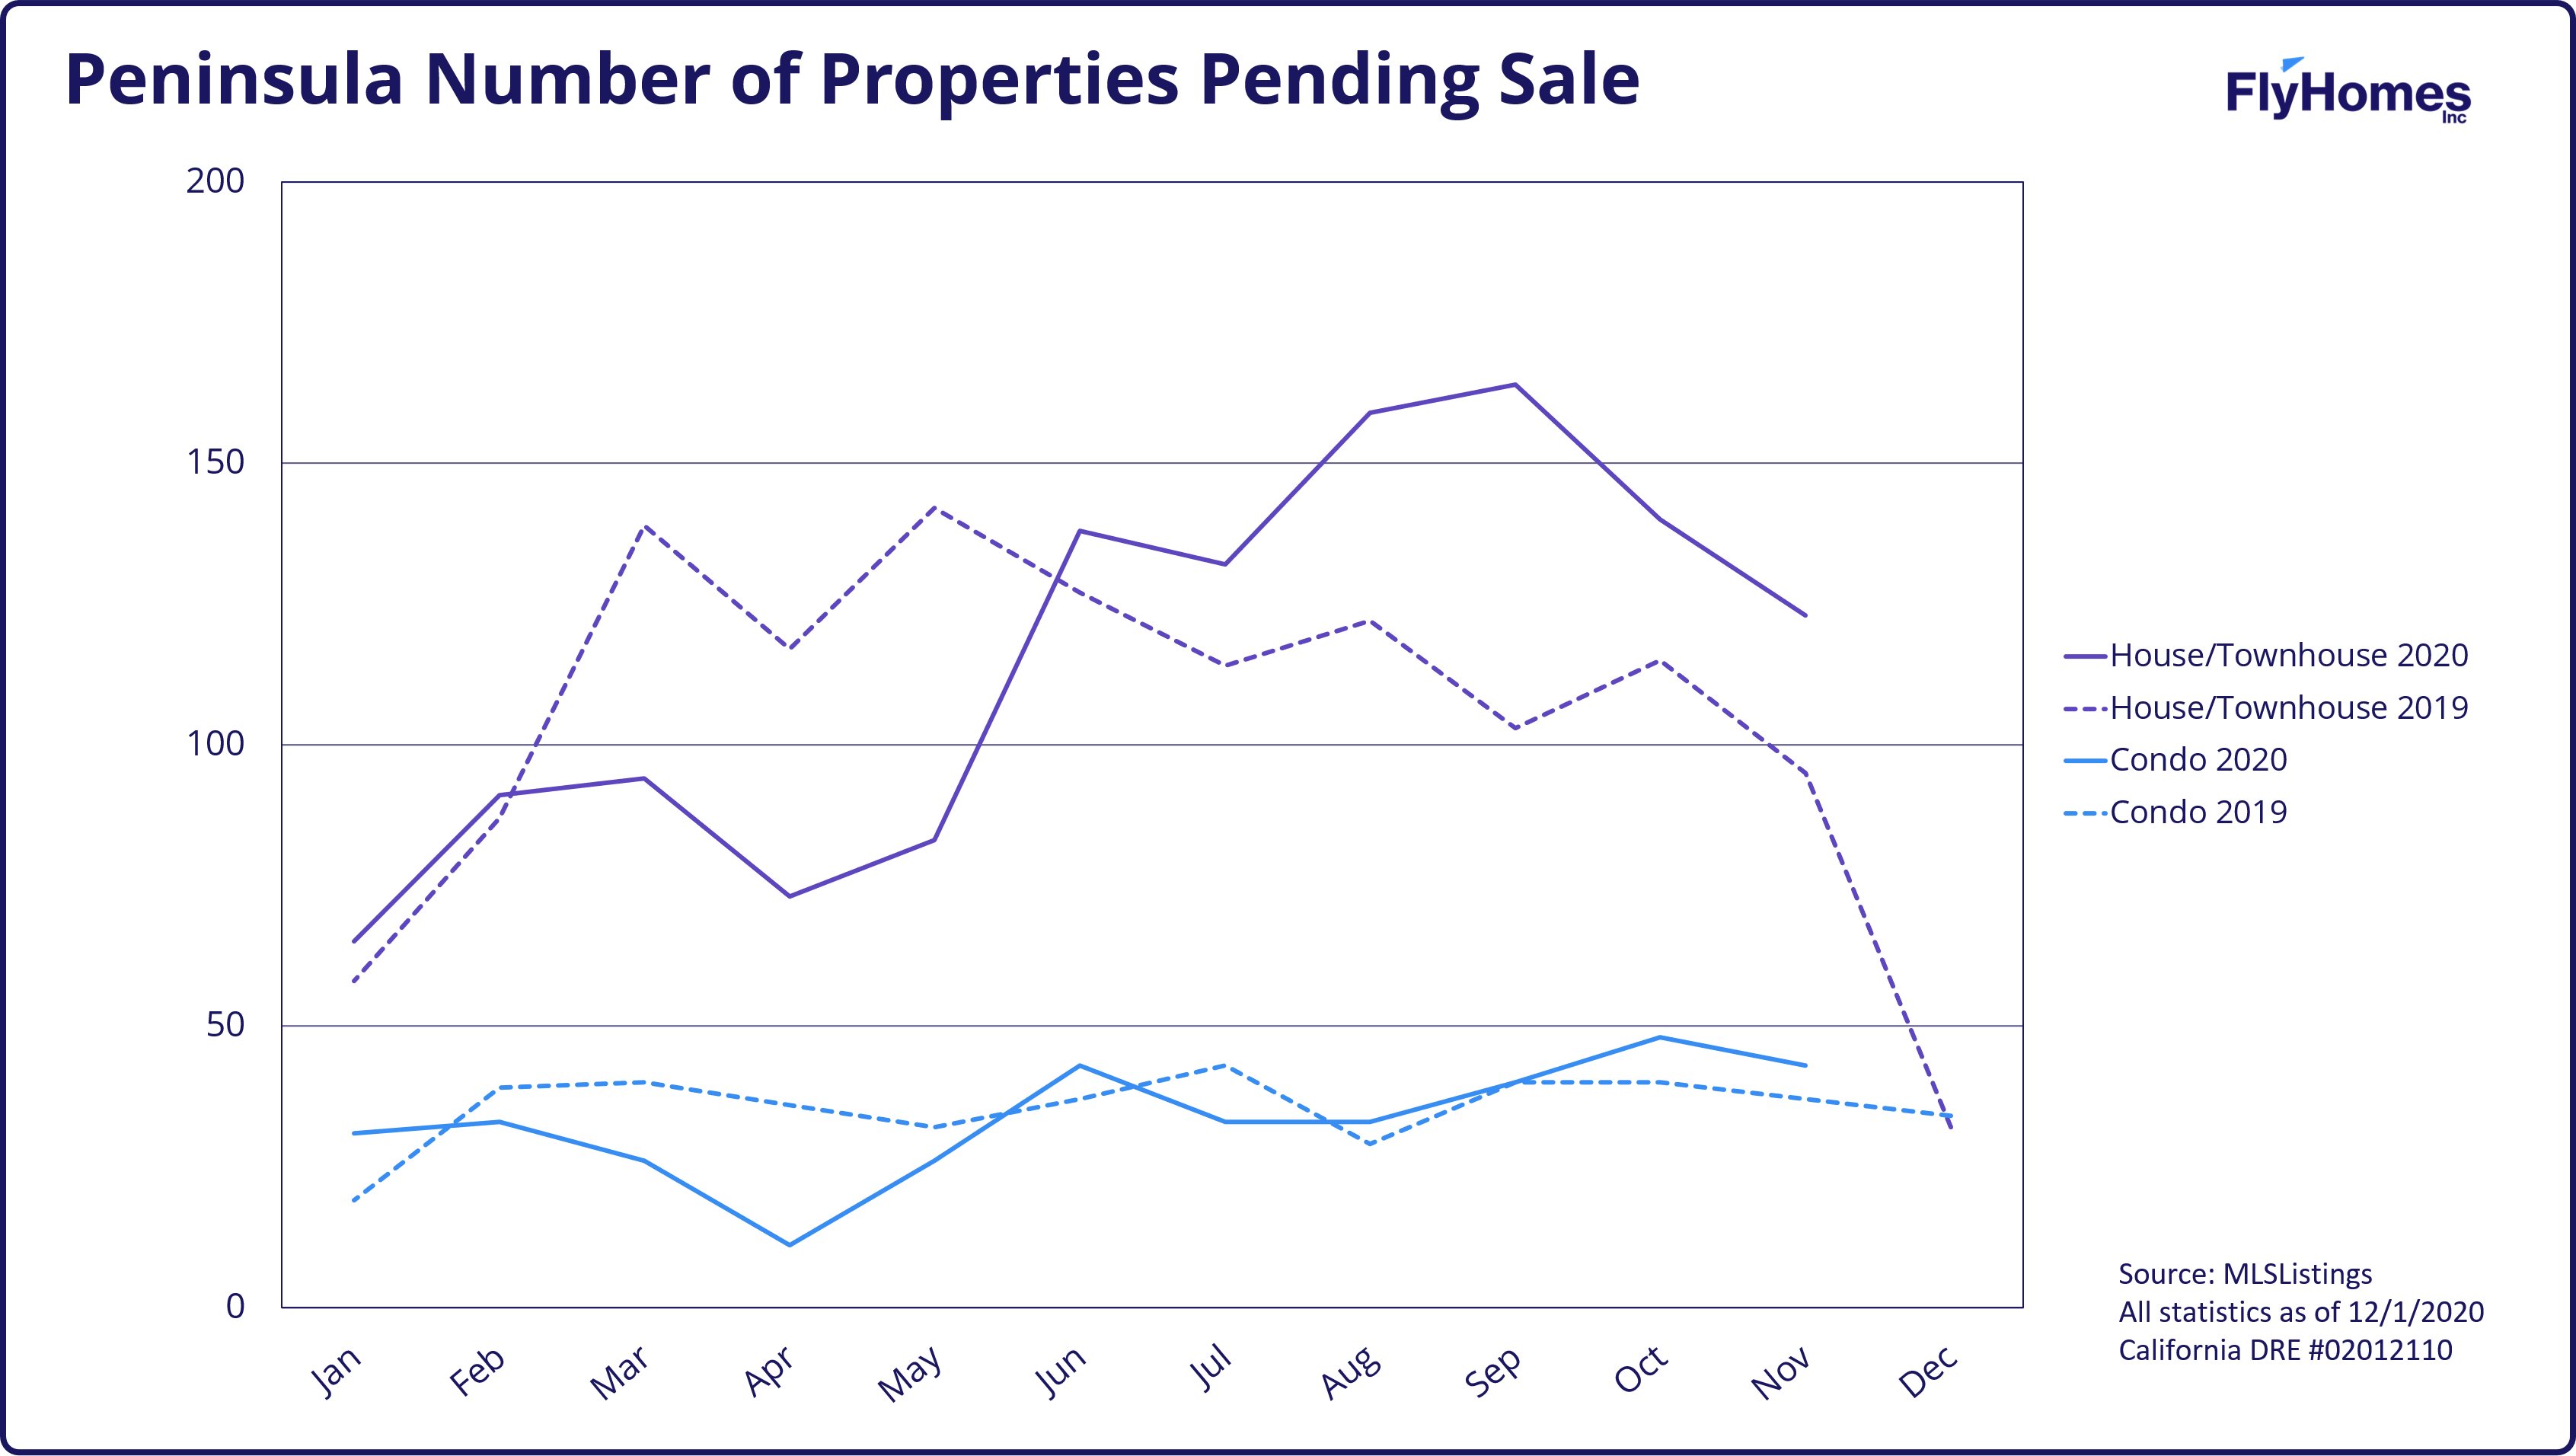
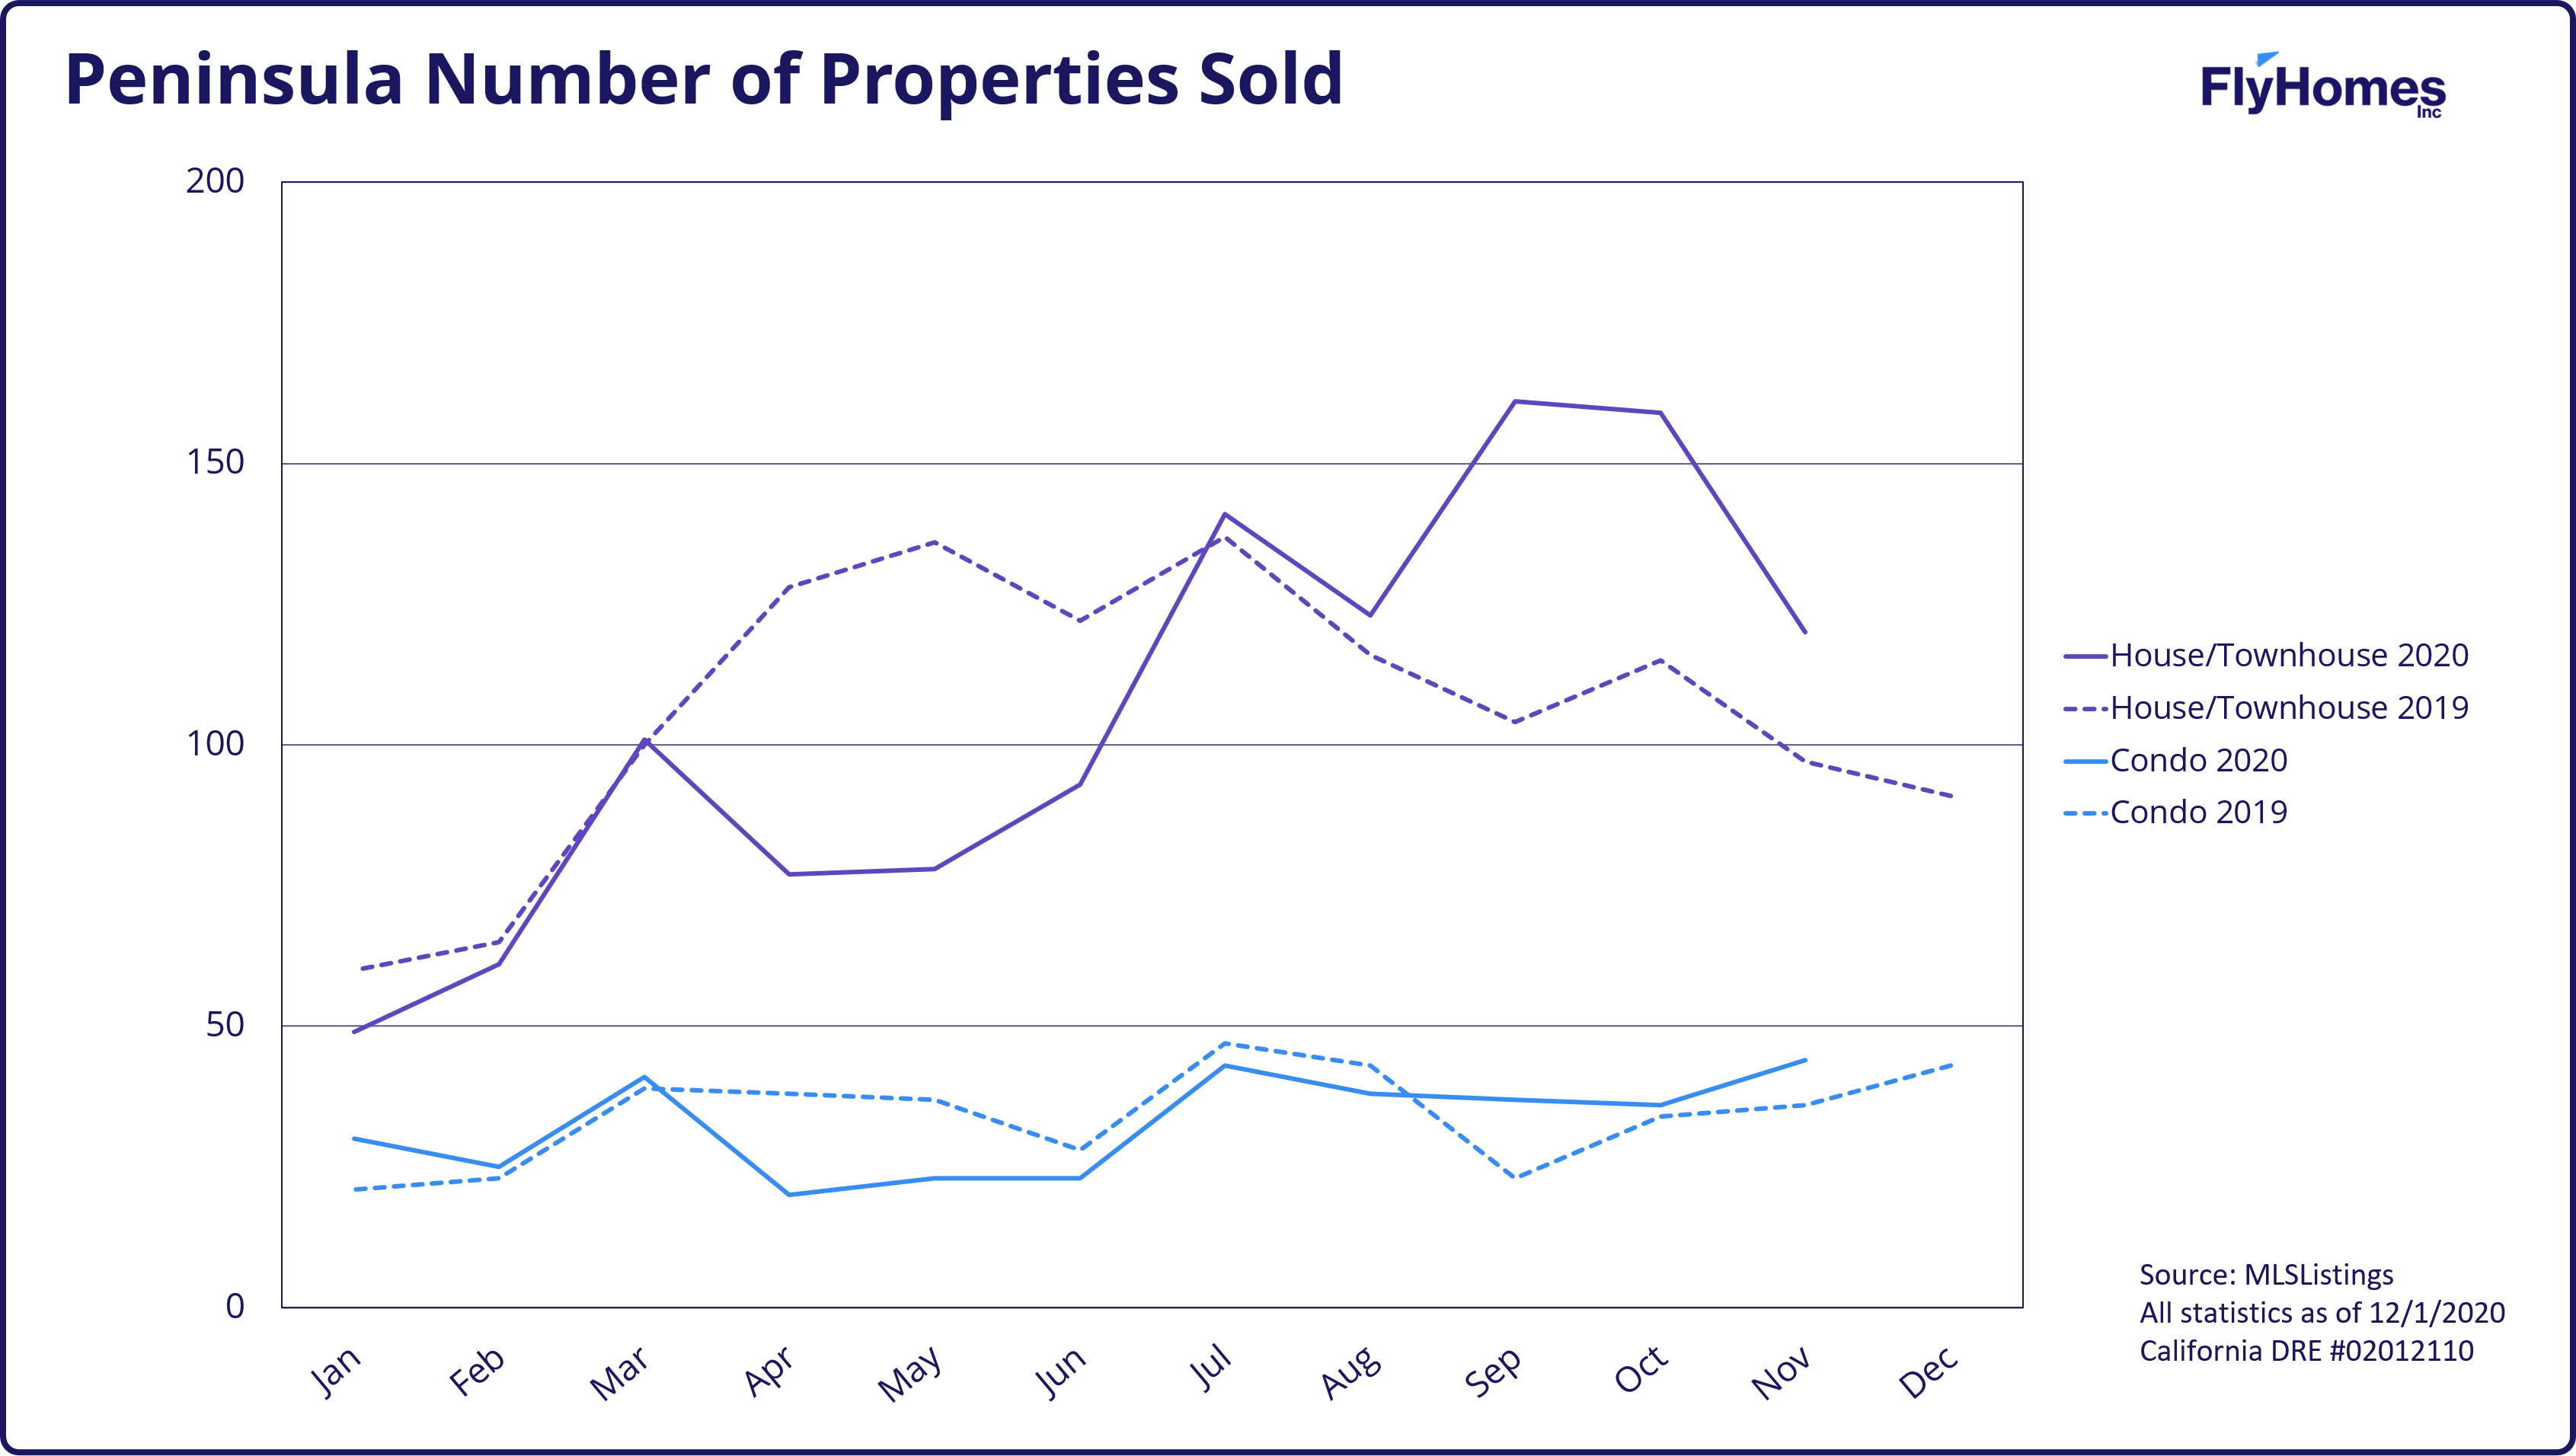
- This is our first month reporting on the Peninsula. It’s seeing a trend similar to last year. The number of homes being listed is down from October, reflecting expected seasonality. Median days on market for condos are up both month over month and year over year, which may indicate a decrease in condo popularity because of the pandemic inspiring some homebuyers to look for more space and more distance from their neighbors.
Competition
Our Research Team looked into sales in a select area for a snapshot of competitiveness in the local market.

Sale Price
Based on date the property sold.
List Price
Based on date the property was listed.
Sale Price Compared to List Price
Based on date the property sold.
Days on Market
Based on the number of days between the list date and the date the property went pending, except when sold date is earlier than pending (then based on date sold).

Number of Properties Listed
Based on date the property was listed.
Number of Properties Pending Sale
Based on the date the property went pending, except when sold date is earlier than pending (then based on date sold).
Number of Properties Sold
Based on date the property sold.
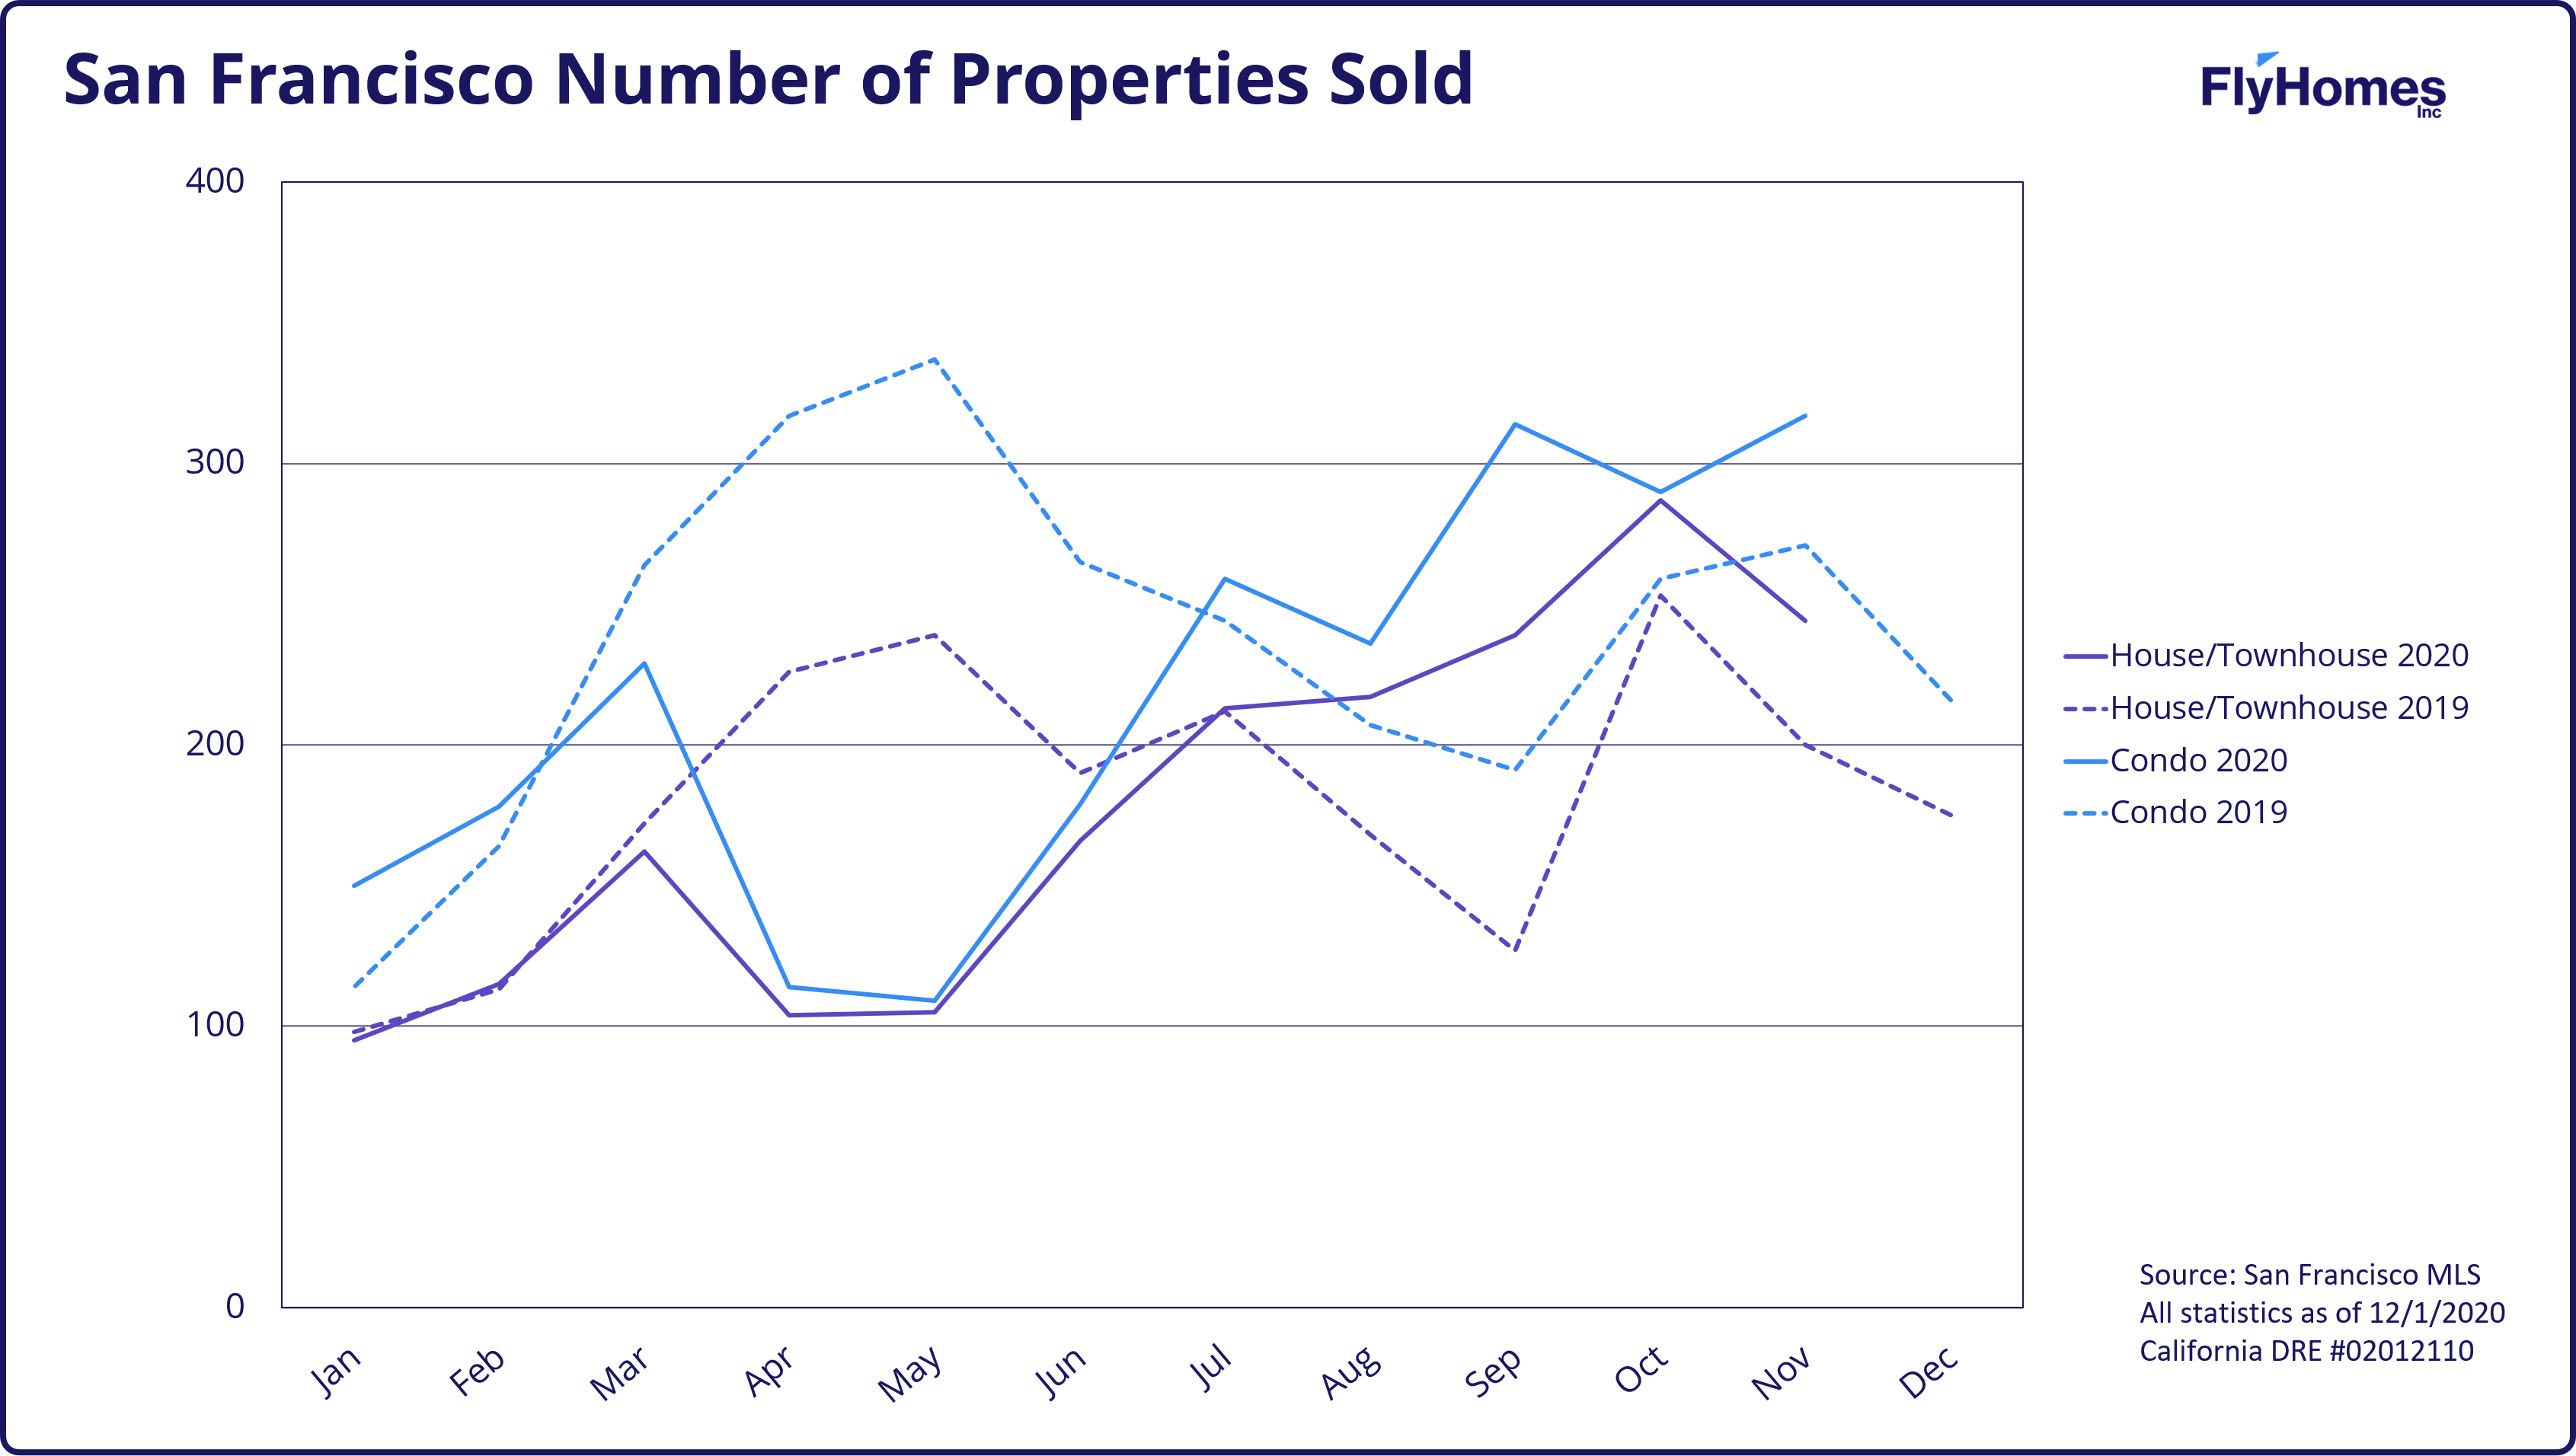
San Francisco includes data for the city of San Francisco.
East Bay includes data for Oakland and Berkeley.
South Bay includes data for San Jose, Santa Clara, and Sunnyvale.
Peninsula includes data for San Mateo, Foster City, Belmont, and San Carlos.
Thinking about buying a home?