


We noticed seven big changes in Seattle this year—plus nine important market trends buyers and sellers should be aware of.
Key takeaways:
- More sellers are canceling their listings and dropping their prices than before. But the median sale price is still 8% higher than it was last year.
- Monthly mortgages have steadily grown more expensive than rent this year.
- As single-family homes get more expensive, demand has shrunk and more homes are for available for sale than have been in a year.
- Despite Seattle’s current market correction, single-family homes have appreciated by an average of 8.9% per year over the last 10 years.
After several years of fast-paced growth, Seattle’s market has started to normalize over the last 12 months. But despite the doom-and-gloom headlines you may have seen recently, the market isn’t in a free fall.
If you’re a homeowner or looking to buy soon, it’s important to know what’s going on in the local market so you can make informed decisions. Wondering where to start? The Flyhomes Research team has compiled some of the city’s most important changes and trends in 2022 that you should know.
7 big changes in Seattle’s housing market
New developments and updates to city structures can impact the value of nearby homes. Here are seven things that happened in Seattle in 2022 that could affect its housing market.
1. West Seattle’s bridge reopened—with potential to increase home prices
For more than two years, Seattle residents couldn’t easily travel in and out of West Seattle. Despite that inconvenience, home prices in that area still grew by a relatively modest 10%. But with the bridge reopening on September 18, we might see West Seattle homes dramatically increase in value.
2. Seattle prepared for over 1,700 new affordable housing units
Around $80 million from “JumpStart Seattle,” the city’s new payroll tax on big businesses, will go toward building over 1,700 housing units for low-income residents.
3. New apartment buildings are set to break a five-year record
Seattle could have as many as 15,341 new apartment buildings by the end of the year, which is a five-year record for the city. With so many new apartments, rent prices may eventually go down.
4. Seattle continued to transform its waterfront
The city’s multi-year Waterfront Seattle project is set to finish in 2025 and could have a significant impact on the value of homes nearby.
5. Rainier Beach got more than 1,000 new housing units
There are around 20 new major development projects in the works in Rainier Beach. You can expect to see at least 1,030 new housing units by 2025, hundreds of which are dedicated to affordable housing.
6. Yesler neighborhood prepared to welcome new apartments
Earlier this year, Vulcan Real Estate broke ground on its largest residential community at Yesler. This will add 345 apartment units to the growing neighborhood.
7. American Capital Group introduced a new multifamily development
The Seattle suburbs of Shoreline are expecting another 240 housing units with this project. Construction has already started and is expected to finish by the end of next year.
9 market trends buyers and sellers should pay attention to
How are these landscape changes affecting Seattle’s overall housing market? Here are eight trends to keep your eye on.
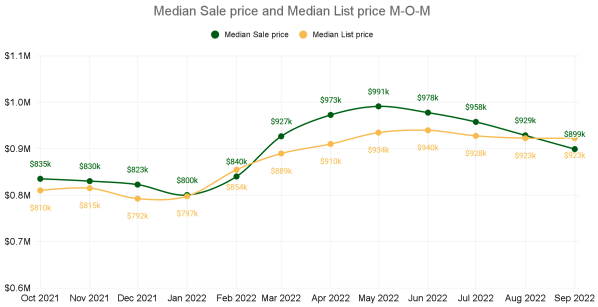
1. Median sale price vs. list price
If you’re on the hunt for a new home, now may be a good time. Although the median list price has increased by 14% since October 2021, the median sale price is only 8% higher. In other words, not as many homes are selling at the asking price or above. In fact, homes started selling slightly below the list price in September 2022.
Here’s a look at how the median sale price and list price have changed this year:

2. New listings, active listings, and pending listings
Have you noticed more homes on the market than before? It’s not your imagination. Active listings (homes for sale) in Seattle have increased by 130% since May 2022. Meanwhile, pending listings (homes with an accepted contract) have decreased by 37%. This increase in available homes means more opportunities for buyers.
Take a look at how active, pending, and new listings have changed in 2022:

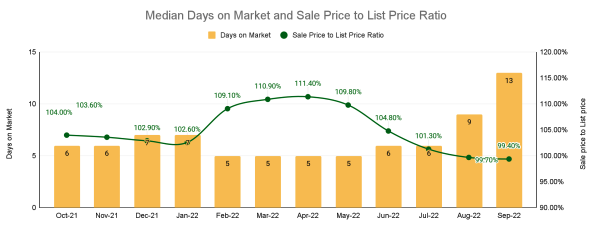
3. Sale-to-list-price ratio and days on market
Although the term “sale-to-list-price ratio” sounds complicated, it’s really just the home’s final sale price divided by the last list price. This percentage has been gradually declining since April 2022. It even dipped below the list price as of August.
The median number of days on market, though, has been rising recently, hitting a peak of 13 days in September.
Check out the chart below to see how the sale-to-list-price ratio and the days on market are shifting:

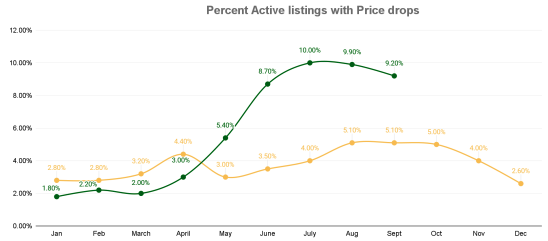
4. Percentage of listings that reduced their price
As homes continue to sell below the list price and stay on the market longer, it makes sense that sellers are starting to drop their asking prices. The percentage of listings that reduced pricing rose from 2% in March 2022 to 10% in July. And although the number has slightly dipped in recent months, it’s nowhere near as low as it was before.
Curious to see how this number has changed over the last two years? Check out the chart below:

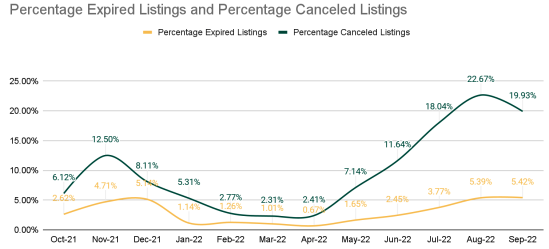
5. Expired and canceled listings
If a home doesn’t sell by the end of the period that the seller and their real estate agent agreed on, it’s called an “expired listing.” A “canceled listing,” on the other hand, is a home that the seller and their agent agree to terminate. As Seattle’s market starts to correct itself, it’s no surprise that the number of expired and canceled listings has increased this year.
See how the percentages of canceled and expired listings have changed in 2022:

6. Rent vs. monthly mortgage payments
In many areas in the U.S., monthly rent tends to be more expensive than a mortgage. That was the case in Seattle, too, back in October 2021—but not anymore. In 2022, mortgage payments have become increasingly more expensive than rent. In September, a typical payment for a 30-year fixed-rate mortgage with a 20% down payment was 25% more expensive than monthly rent.
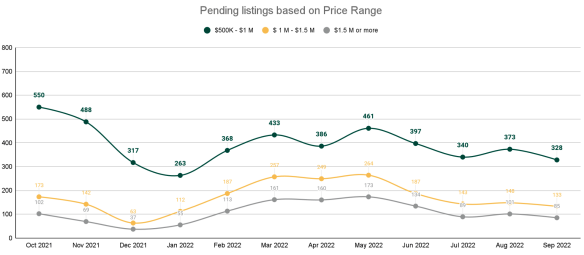
7. Demand based on home price
The more interest rates continue to climb, the less affordable mortgages become. And as a result, demand for single-family homes has decreased. Around 40% fewer homes between $500,000 and $1 million went pending compared to last year.
However, buyers with higher incomes don’t seem to be as affected by surging interest rates. Demand for homes that cost $1.5 million or more has only decreased by 16%.
Check out the chart below to see how demand has changed in 2022:

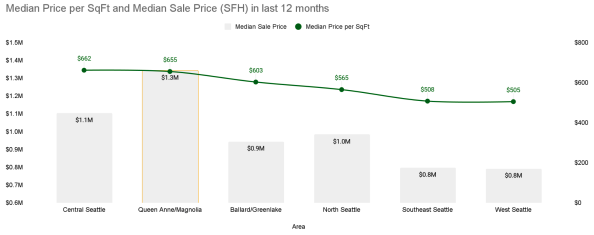
8. Price changes in Seattle’s various districts
You won’t find the same home prices in each of Seattle’s districts. In the city’s most affordable district—West Seattle and Southeast Seattle—the median sale price is $800,000 and the median price per square foot is around $505. In Queen Anne, however—Seattle’s most expensive district—the median sale price is $1.3 million with a median price per square foot of $655.
See the pricing differences in Seattle’s districts in the chart below:

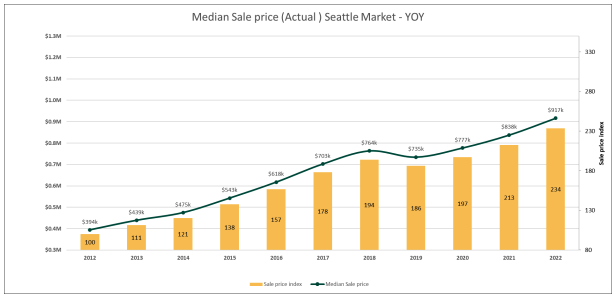
9. Long-term appreciation
Even though Seattle is facing a market correction, the sale price for homes has significantly risen over the last 10 years. From 2012 to 2022, the median sale price of single-family homes has appreciated by 134%, with an average growth of 8.9% per year.
Here’s how the median sale price has grown in Seattle since 2012:

Wrapping up
What do these trends mean for buyers and sellers in Seattle? It may be a good idea for sellers to price their homes just below market value to attract more buyers. Remember, too, that short-term trends only tell half the story—Seattle’s long-term market appreciation is still going strong. And if you’re looking to buy right now, enjoy the increasing opportunities to find a home you love, perhaps even below the asking price.