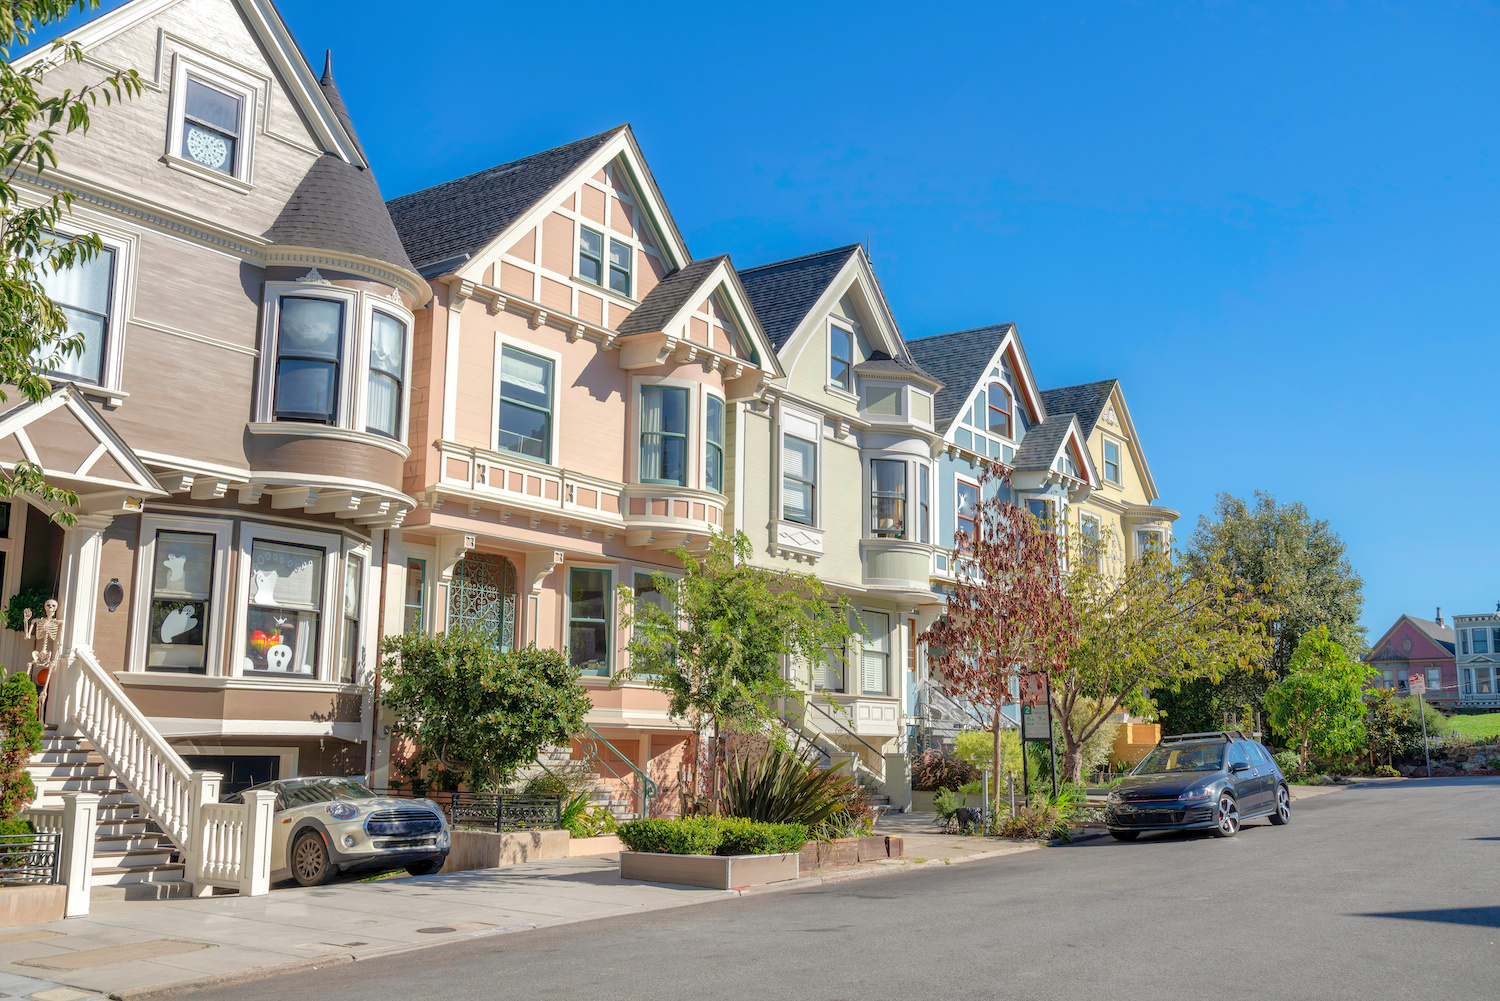
In San Francisco, median selling price, median list price, inventory, and sale to list price ratio all increased in February. In another positive sign, average Days On Market dropped almost 50% MoM. Read on for key metrics in San Francisco, and other metros in the Bay Area.
Home prices
Mortgage calculator: Estimate your monthly payment
All calculations are estimates and provided for informational purposes only. Actual amounts may vary.
-
- Principle and interest -
- Homeowner's insurance $112
Introduce me to Flyhomes Mortgage
Inventory

Competition
Competition report
Our research team analyzed the competition in select local areas.
San Francisco includes data for the city of San Francisco.
East Bay I includes data for Oakland and Berkeley.
East Bay II includes data for Fremont, Newark, and Union City.
Tri-Valley includes data for Dublin, Pleasanton, and San Ramon.
South Bay includes data for San Jose, Santa Clara, and Sunnyvale.
Peninsula includes data for San Mateo, Foster City, Belmont, and San Carlos.


