Bay Area Housing Market Report: September 2022

Golden Gate Bridge

Home prices in San Francisco were mostly level from last month. The median home in San Francisco sold for $1,700,000. The average home was listed for $1,695,000. Single family homes in San Francisco spent an average of 14 days on market and were $1,014 per square foot.

Home prices


San Francisco:

$1,795,000

$1,700,000

99.5%


East bay:

$995,000

$1,100,000

107%


South Bay:

$1,500,000

$1,400,000

93%


Tri-valley:

$1,549,950

$1,489,850

96%


Peninsula:

$2,175,000

$2,000,000

92%


Mortgage calculator: Estimate your monthly payment

All calculations are estimates and provided for informational purposes only. Actual amounts may vary.

Mortgage per month
-
  • Principle and interest -
  • Homeowner's insurance $112
See how much you qualify for
Introduce me to Flyhomes Mortgage
$
20%
%
See how much you qualify for
Introduce me to Flyhomes Mortgage

Inventory


San Francisco:

324 homes listed

158 homes pending sale


East Bay:

367 homes listed

211 homes pending sale


South Bay:

692 homes listed

460 homes pending sale


Tri-valley:

177 homes listed

124 homes pending sale


Peninsula:

185 homes listed

83 homes pending sale


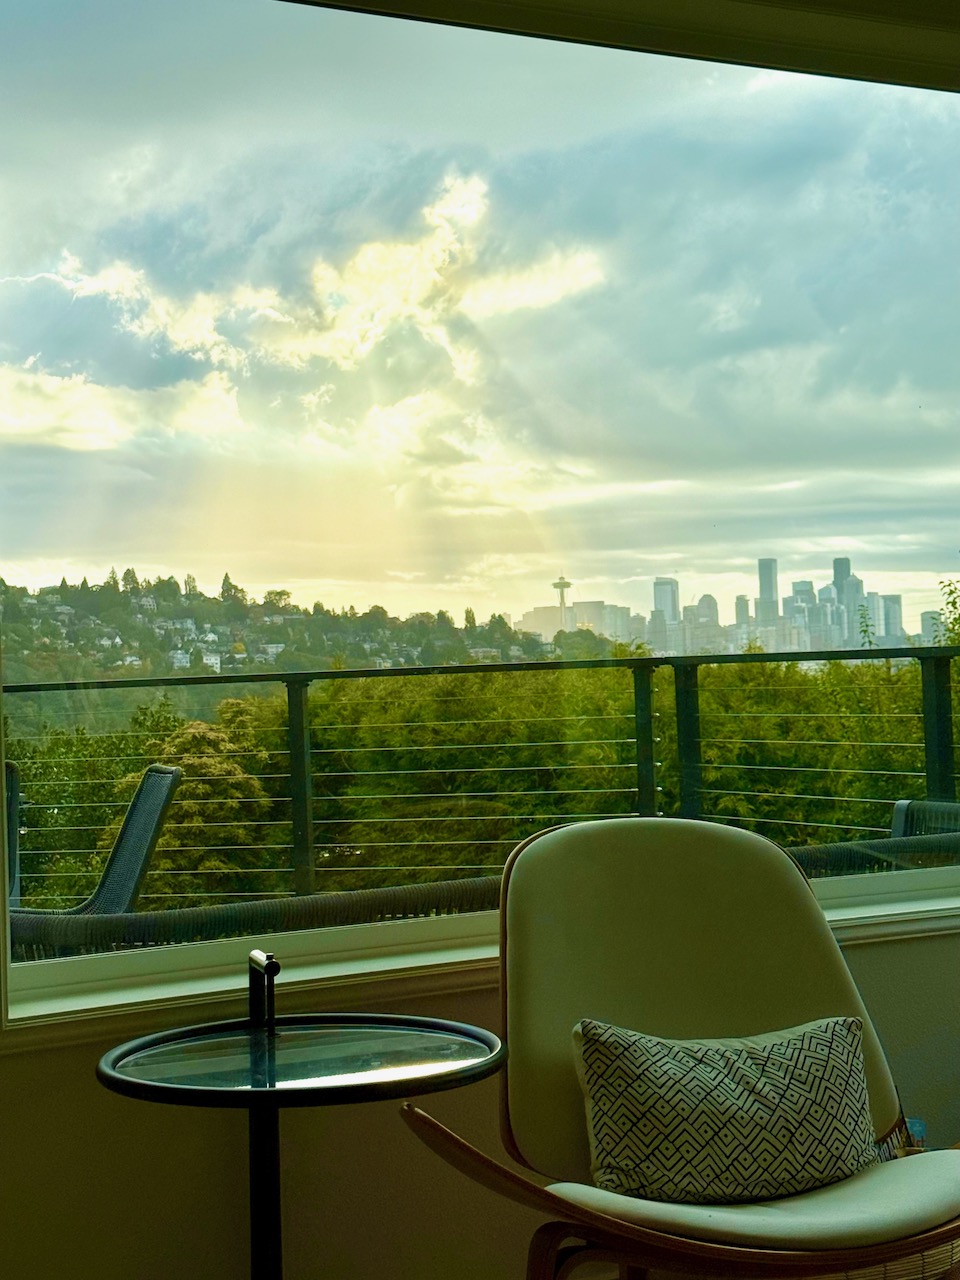
city skyline during golden hour
Browse Bay Area listings

Competition

San Francisco days on market: 14

East Bay days on market: 14

South Bay days on market: 9

Tri-valley days on market: 18

Peninsula days on market: 3


Competition report

Our research team analyzed the competition in select local areas.

San Francisco includes data for the city of San Francisco.

East Bay I includes data for Oakland and Berkeley.

East Bay II includes data for Fremont, Newark, and Union City.

Tri-Valley includes data for Dublin, Pleasanton, and San Ramon.

South Bay includes data for San Jose, Santa Clara, and Sunnyvale.

Peninsula includes data for San Mateo, Foster City, Belmont, and San Carlos.