Real estate data for your area
March 2022 real estate highlights
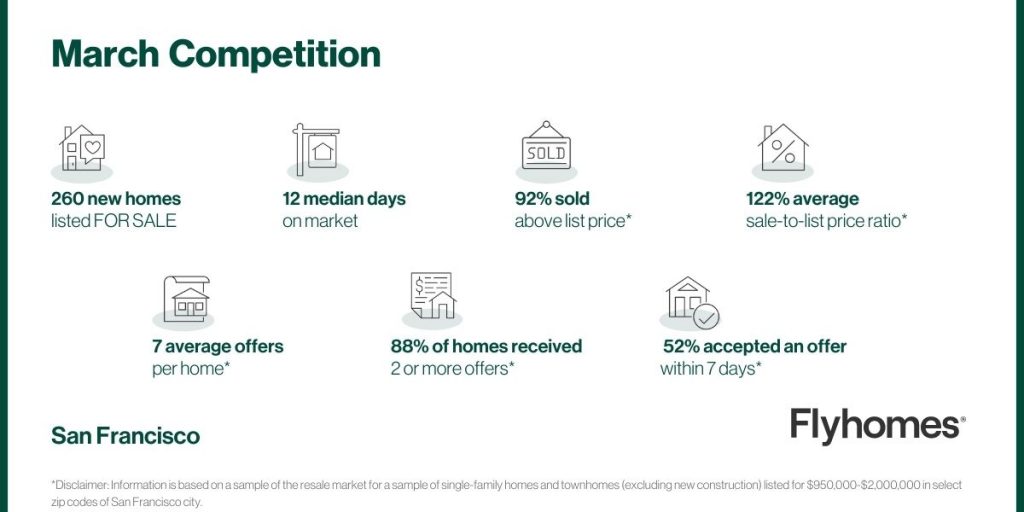
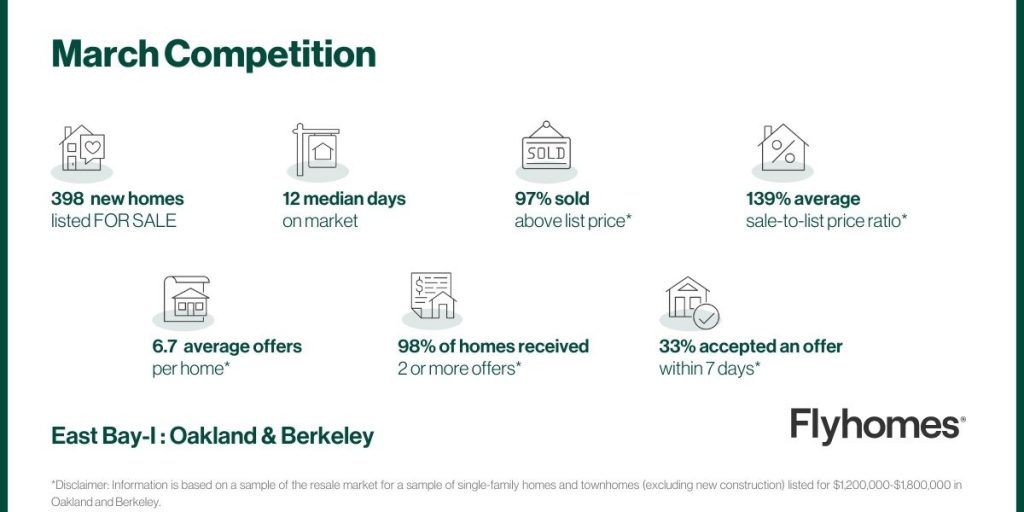
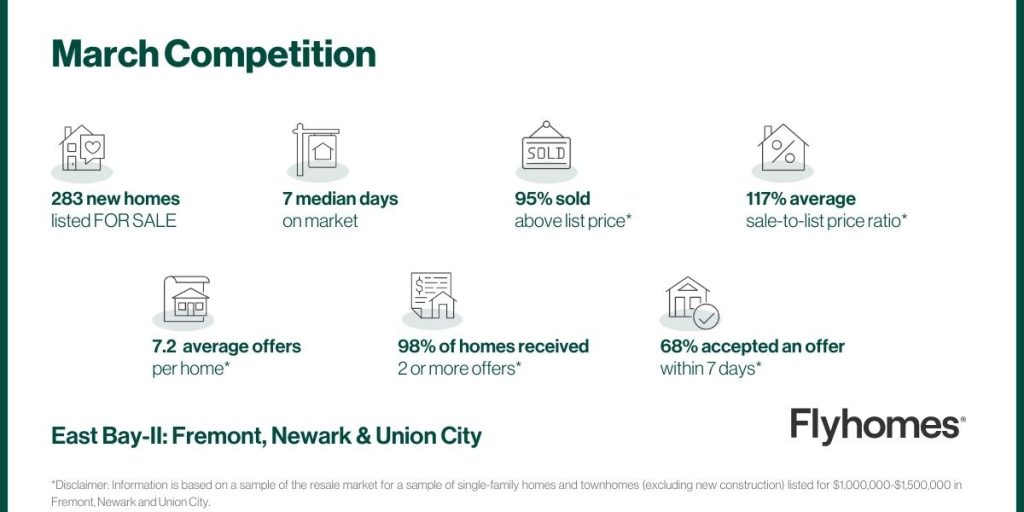
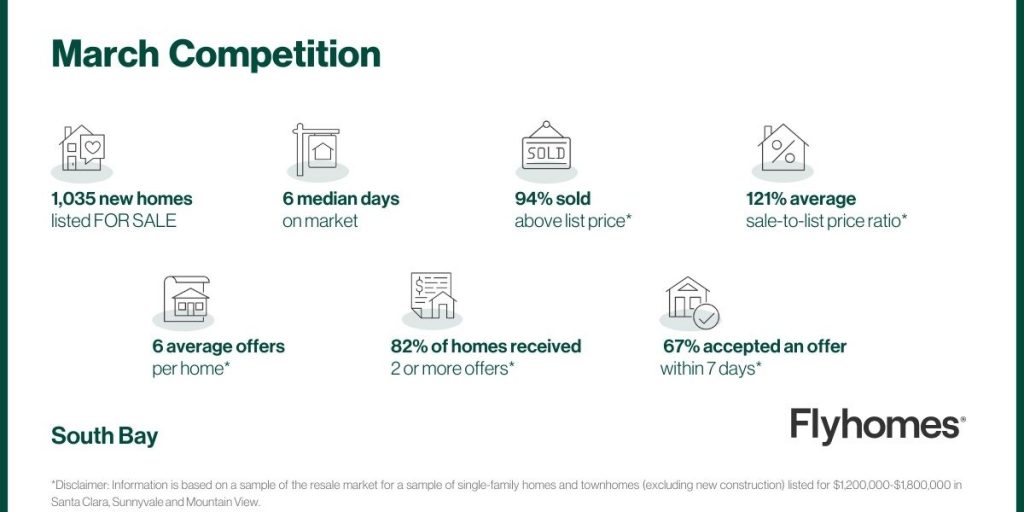
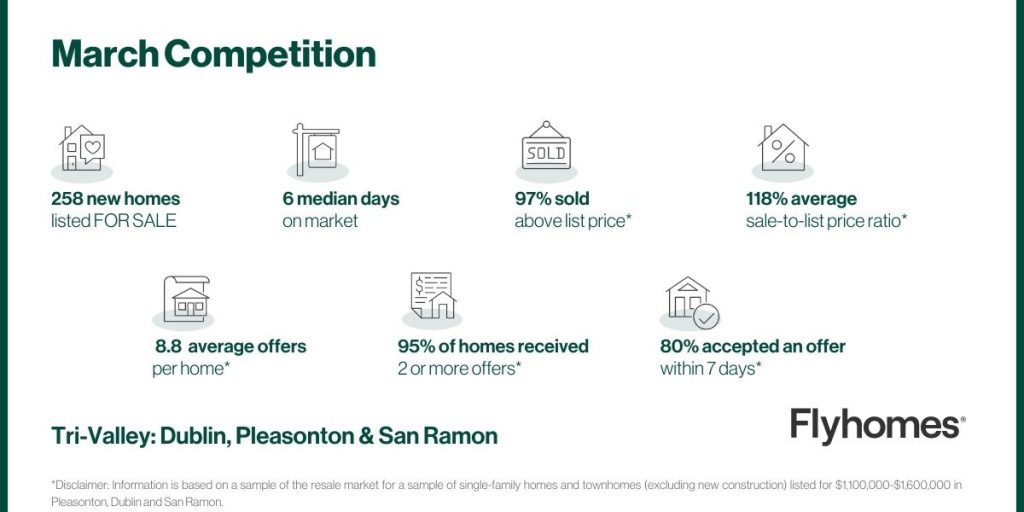
Housing prices increased everywhere across the bay in March. In San Francisco, the median sale price for a home was $2.2 million. The most expensive area was on the Peninsula, at $2.3 million while the most affordable was in the East Bay at $1.2 million. Homes everywhere were selling for well above list price with the average home in San Francisco selling for as much as 23% above asking. Competition remains steep in the Bay Area, where homes sell in an average of 12 days in San Francisco, and as fast as 6 days in the South Bay and Tri-Valley region.
February 2022 highlights
Competition in San Francisco and the greater Bay Area is more fierce than it’s been in recent months, with sale prices higher than they’ve ever been, outpacing listing prices more than in any recent year. New inventory outpaced sales by a small margin, though homes were still snapped up in as quick as a week indicating hungry buyers willing to close fast, well above list price.
- The sale-to-list-price ratio was higher than it’s ever been The median sale price in the Bay Area topped $2 million for the first time, landing 22% higher than the average list price.
- The East Bay was a slightly less competitive market than its neighbors Homes in the East Bay took a little longer to sell in February, keeping list prices flat and sale prices to increase by less than 2%. But the prices still ranged over $1 million.
- Condo prices in the South Bay recovered to 2021 levels During the first month of 2022, condo values in the South Bay dipped 13% down to below $700,000 for the first time since October 2021. But heading into February, condo values rose again to their previous peak at nearly $750,000.
- The Peninsula remained the most expensive market for homebuyers At $2,260,000, the median selling price for homes on the Peninsula remained the highest in the Bay Area, continuing a trend that lasted for at least the entire previous year.
January 2022 highlights
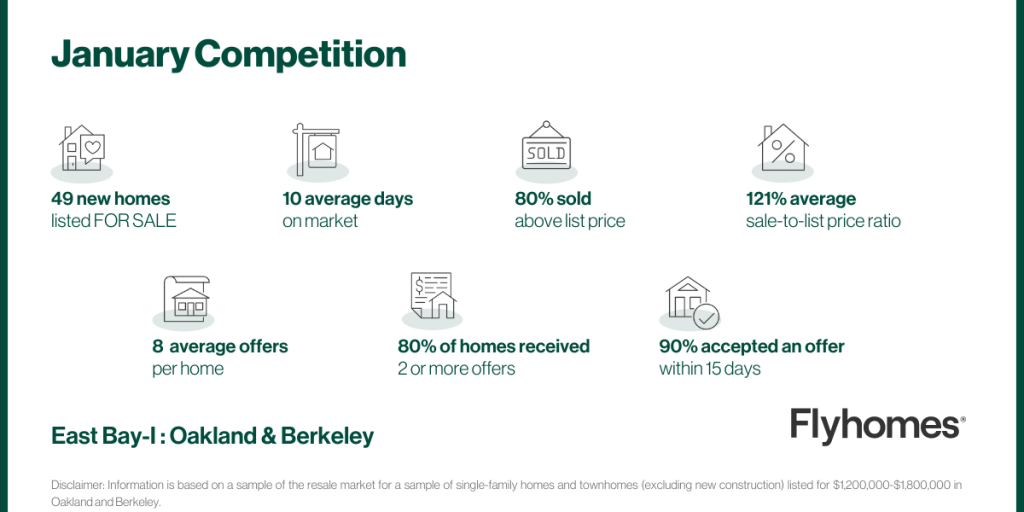
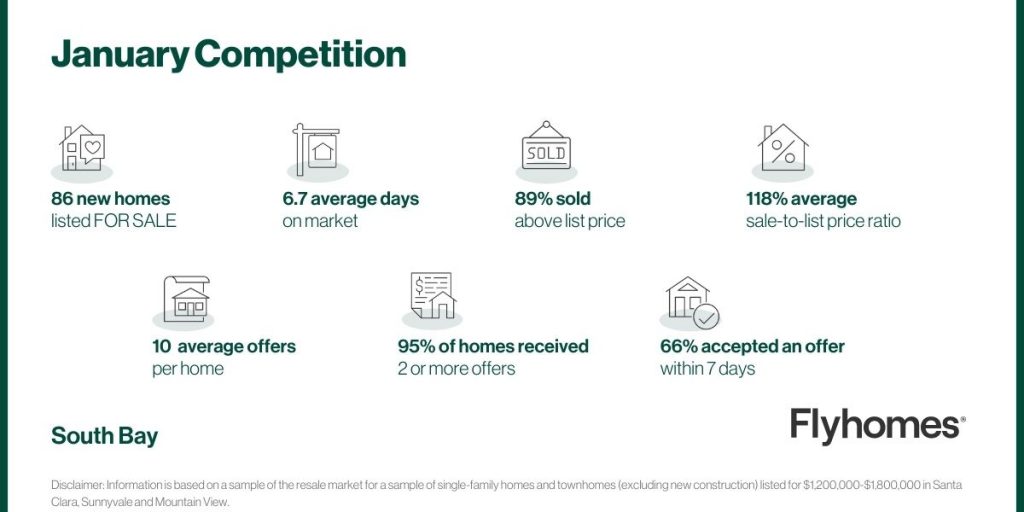
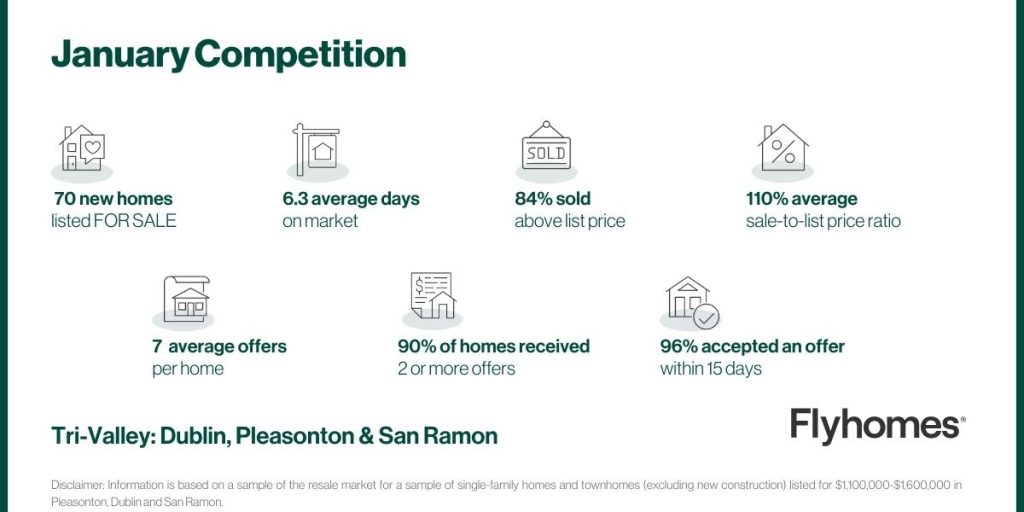
The Bay Area is experiencing a period of adjustment that is a likely response to the new year and the predicted rise in inflation. Sale prices are down, though not by much. And list prices are on the rise as competition seems to be rising heading into the end of the slow winter season.
- List prices rose to meet demand List prices were considerably lower last month, but as inflation heats up and competition remains steady, sellers are seeing an opportunity to garner higher offers. At $1,644,000, list prices are up almost 35% over last month.
- List prices are reflecting the increasing demand A spike in list prices over last month shows that sellers noticed that sale prices were well above asking. This month, sale prices dipped but not enough to even out the sale-to-list-price ratio as homes were still selling for 116% of their asking, at $1,650,000.
- Three different areas of the Bay Area saw a decline in sale prices San Francisco proper, the East Bay, and the Peninsula all saw declines in the average selling price for single-family homes and townhouses.
- Homes in the Tri-Valley region experienced the largest spike in prices Both single-family homes and townhouses experienced the highest increase in the Tri-Valley area, at over 12% growth from $1,550,000 to $1,7550.
- The East Bay remains the most affordable area for buyers The price of homes in the East Bay region dropped by over 7% in January from $1,087,500 to $1,007,500, well below the next most expensive area in the South Bay, at $1,500,000.
December 2021 highlights
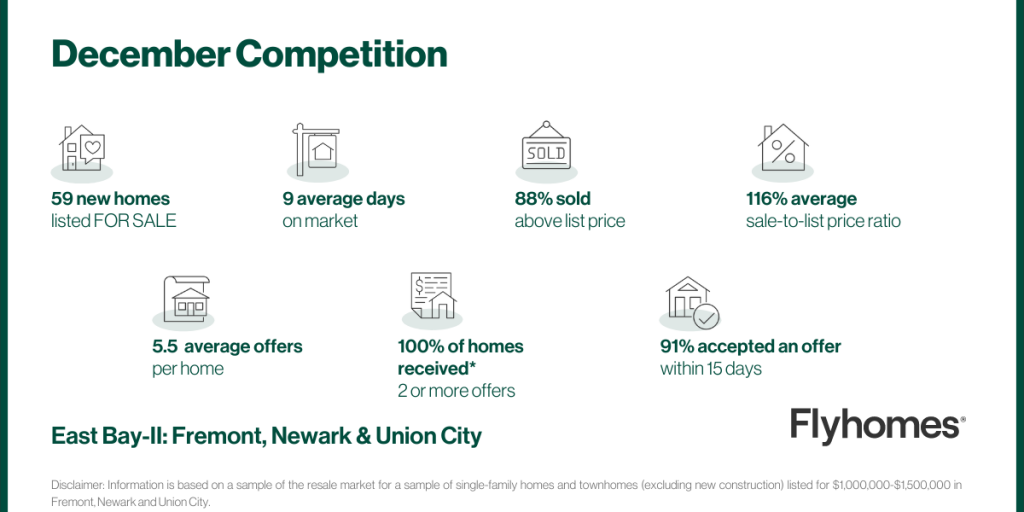
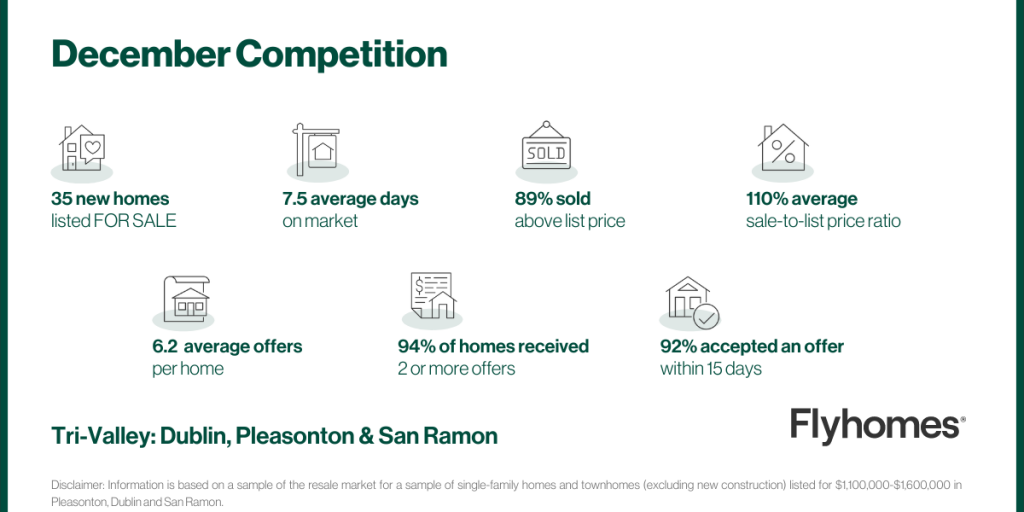
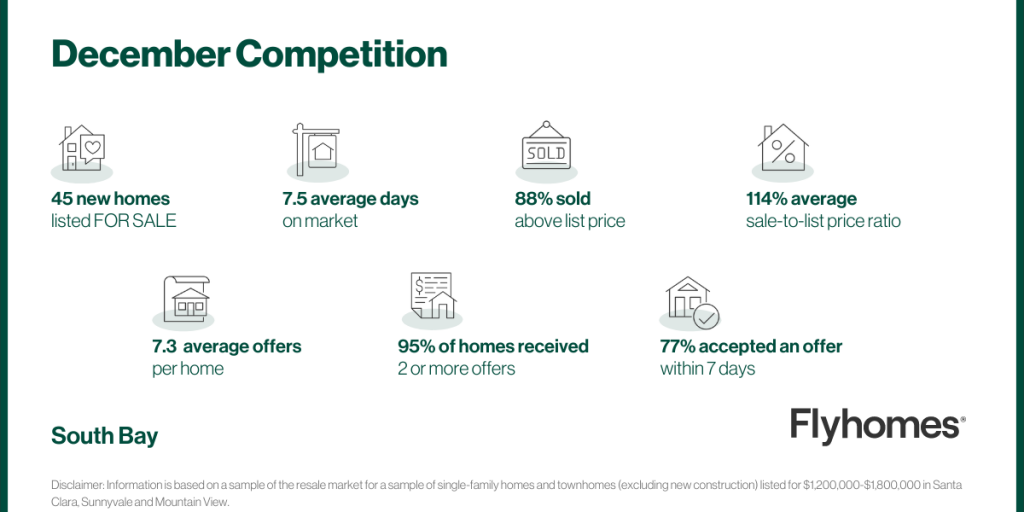
Most metrics in the Bay Area showed signs of the market leveling off. Competition slowed as homes spent more time on the market while inventory increased. Sellers responded accepted offers that were, on average, closer to their lower list prices.
- List prices dipped to a year-end low At an average of $1,197,000, list prices in the greater Bay Area reached a low for the year in December.
- Sale prices reflected an increase of housing inventory and a competition slow-down The Bay Area can depend on sale prices averaging higher than list prices by as much as 19% or 20%. At the end of the year, that ratio slid to 14%, likely because homes spent an average of 27 days on the market—the second-longest amount of time spent on the market for the year.
- The number of days that homes in the East Bay spent on the market were the highest of the year Days on market is an important metric buyers can use to understand just how competitive their market is. December was the least competitive month of the year in the East Bay, as homes were on the market for 19 days—the longest time of the year.
- Metrics in the South Bay changed the least month over month Key measurements of the market’s competitiveness remained the most stable from one month to the next in the South Bay. The amount of days homes stayed on the market remained seven from November to December. List prices fell by a small 1% from $1,366,500 to $1,348,800.
- The Peninsula remained the most expensive and competitive area Homes on the Peninsula spent only one extra day on the market than they did the previous month, even though list prices climbed 1.3%. Homes here were sold for a median price of $2,000,000, an average of 2% higher than the area’s list price of $1,800,000.
November 2021 highlights
The Bay Area showed consistency in most of its metrics, suggesting a more predictable market. Most notably, the number of pending homes decreased over 6%, which meant that a slight increase of inventory led to a small decrease in demand.
- San Francisco single family homes were selling for the highest prices since the summer. For most of the spring and fall, single-family homes were selling for around $1.8 million. The summertime is peak selling season so homes were going for closer to $2 million in May, June, and July. But this November, median home prices rose again to $1,925,000.
- Berkeley and Oakland (East Bay I) saw little change. Median sales prices for homes in the East Bay were predictably less than those in San Francisco proper, but unlike in the city, the sale-to-list-price ratio was higher in the East Bay. In the East Bay, homes sold for around 10% over list price.
- The Tri-Valley area remains one of the more predictable markets. Key metrics like Days on Market selling price remained largely flat in November. Homes here were on the market an average of 7 days, which was the same as the previous 5 months. Median selling price ticked up a little from $1,490,000 in October to $1,510,000 in November.
- Fewer homes were listed and sold in the South Bay. The number of listed homes decreased in November to 450 from 675 but a simultaneous dip in the homes sold kept competition even month over month. The sale-to-list-price ratio was at 109%, one of the higher for the year, while the median number days a home was on the market held steady at 8.
- Single family home prices on the Peninsula are consistently up. After a slow start at the beginning of the year, home prices on the Peninsula have steadily increased, beginning to rise again after a previous peak in August. In November, the median price for a single family home reached nearly $2.3 million.
October 2021 highlights
Overall, the Bay Area remained a competitive market in October for buyers interested in the most popular houses, despite a seasonal dip in activity.
- San Francisco single family homes saw the same median price as in July. The 6% month-over-month increase to a median sale price of $1,900,000 may take the place of an expected spike that usually happens in November, before flattening in December. The city saw less activity month over month with 22% fewer properties going pending and 20% fewer listed, but the homes that did sell sold for higher prices.
- Berkeley and Oakland (East Bay I) saw little change. While median sale price and list price for single family homes saw only small fluctuations, median days on market increased 8% from 12 to 13 days. Sale-to-list price ratio dropped 1% month over month but still came in 5% higher year over year, indicating that the area is still significantly more competitive for buyers than in previous years. Condos in the area saw increased activity with 46% more homes pending month over month, but condos sold with a median of 23% more days on market and no significant change in competition (as indicated by sale-to-list price ratio).
- The Tri-Valley area saw a decrease in activity. In October, 15% fewer single family homes went pending month over month, representing 29% fewer year over year. Likewise, 14% fewer single family homes were listed month over month, and 35% fewer year over year. Sale-to-list price ratio dropped less than 1% month over month, but rose 4% year over year, showing that the area has firmly become more competitive for buyers than in years past. Fremont, Newark, and Union City (East Bay II) saw a similar trend, with 20% fewer properties listed year over year and sale to list price ratio up 6% over October 2020.
- The South Bay looked similar to August. The median sale price for single family homes rose 2% to match August at $1,400,000 after a drop in September. Sales slowed by one day with a 14% month-over-month increase in median days on market that marks a return to levels seen in July and August after a dip in September. Fewer properties were listed and pending month over month, and sale-to-list price ratio rose less than 1% to match the August number of 108%.
- The Peninsula saw competition for single family homes. After a slower September, sale-to-list-price jumped nearly 3% month over month as the number of properties listed dropped by 17% and some homes in the area saw heightened competition among buyers. October 2020 also saw a jump in sale-to-list price ratio, followed by decreases in November and December.
September 2021
September 2021 highlights
Across the Bay Area, buyers in September purchased homes at peak-season pace, but at lower sale-to-list ratios, indicating decreased competition. Some regions are firmly into the fall slowdown with fewer homes being listed, while others saw an inventory increase that’s likely a late attempt by sellers who want to move on before the 2021 holiday season.
Note: This month, we split the East Bay into two reports: one for Berkeley and Oakland, and one for Fremont, Newark, and Union City. We also started covering the Tri-Valley area.
- San Francisco listings up, competition down. The number of single family homes listed in San Francisco increased by 60% from August, while the number pending jumped 52%. High volume in September is typical in the city prior to a slowdown in October. Sale-to-list price ratio, meanwhile, dropped 1%. Condos also saw a 60% jump in listed volume, while the number pending increased by only 6%.
- Berkeley and Oakland (East Bay I) were still hot. 25% more single family homes were listed than in August. Buyers swept up homes quickly, with median days on market dropping 15% back to 11 days, a pace last seen at the peak in May. Median list price rose 2%, while median sale price jumped 11% and sale-to-list price ratio increased 2%.
- Fremont, Newark, and Union City (East Bay II) cooled. Median sale price for single family homes stayed flat month over month as fewer homes were listed and went pending, and sale-to-list price ratio dropped 2% as competition softened. Condo sellers listed 43% more units than in August, but the number pending dropped by 8%, indicating that sellers are more eager than buyers.
- The Tri-Valley area entered its slow season. Fewer homes were listed for sale and fewer went pending as the median sale price for single family homes dropped 8% from August to its lowest point since pre-peak in April. Homes continue to sell at the same pace while competition decreases, continuing a two-month trend.
- South Bay sellers are eager. 25% more single family homes and 41% more condos in the South Bay were listed month over month. While the market stayed active with the number of homes going pending increasing by 5% for single family homes and 6% for condos, buyers didn’t keep pace with the big inventory increase and sale-to-list price ratio dropped 1% to the lowest level since February.
- Competition in the Peninsula slowed significantly. Sale-to-list price ratio for single family homes dropped 4% to its lowest number since March. While homes still sold at a quick pace, fewer properties were listed and went pending, and median sale price decreased 1%.


August 2021
The Bay Area is beginning to see seasonal slowdown in the market with median sale price for single family homes dropping across the region, but homes continue to sell at a fast pace.
- Competition cooled slightly in San Francisco, yet homes sold quickly. Median days on market for San Francisco single family homes dropped 36% month over month, while condos dropped a huge 60%. Generally, this quickening would indicate increased competition. However, sale-to-list price ratio dropped slightly at the same time, showing that competition isn’t driving buyers to pay more. What happens in September will be telling.
- The East Bay and South Bay each saw early signs of slowing. Single family home sale-to-list prices fell month over month while median days on market held steady. In the South Bay, 9% more homes were listed than in July and 8% more went pending; the homes that entered the market were sold at a similar pace to peak months.
- In the Peninsula, more homes were listed. August saw 43% more single family homes and 67% more condos listed than July, each coming in at multi-year record numbers of listings. August 2020 also saw the highest number of single family homes for the year.


July 2021
While competition for all home types across the Bay Area remained much higher than in 2020, July saw some areas begin to see the start of an expected seasonal slowdown.
- San Francisco is still competitive. Sale-to-list price ratio for single family homes rose 2% month over month, jumping to a multi-year high of 120%, a year-over-year increase of 15%. This activity may have been focused on a small number of popular homes as median sale price dipped 8% month over month and the number of single family homes pending dropped 9%. The number of properties listed jumped nearly 50%, correcting from a significant dip in June. Condos saw more signs of slowing, with median days on market increasing by 11% and sale-to-list price ratio dipping by a slight 1% while the number of new condos listed rose a whopping 145%.
- East Bay single family home sales slowed, while condos stayed active. While competition and activity for single family homes continue to far outpace last year, they saw month-over-month dips in median list price, the number of properties listed and pending, and sale-to-list price ratio. Sale price fluctuated up slightly month over month, maintaining a gap over 2020 at a 25% year-over-year difference. Median days on market rose 8%. Meanwhile, condos saw median days on market dip 8% with 33% more condos listed month over month as median list price dropped 8%, indicating that sellers are pricing low to encourage competition.
- The South Bay saw the start of a seasonal slowdown. Median days on market for single family homes rose 14% to eight days, breaking a three-month streak at 7 days preceded by a low of 6 days in March. Median sale price, list price, and sale-to-list price ratio all fluctuated downward.
- The Peninsula is still active, but maybe only for certain homes. Median days on market for single family homes fell 43% month over month to a multi-year low of only four days after four months holding at seven days. Sale-to-list price ratio is also up slightly. However, median list price and sale price both dropped, indicating that a few popular homes may have skewed the overall data for July.
Competition snapshot


June 2021
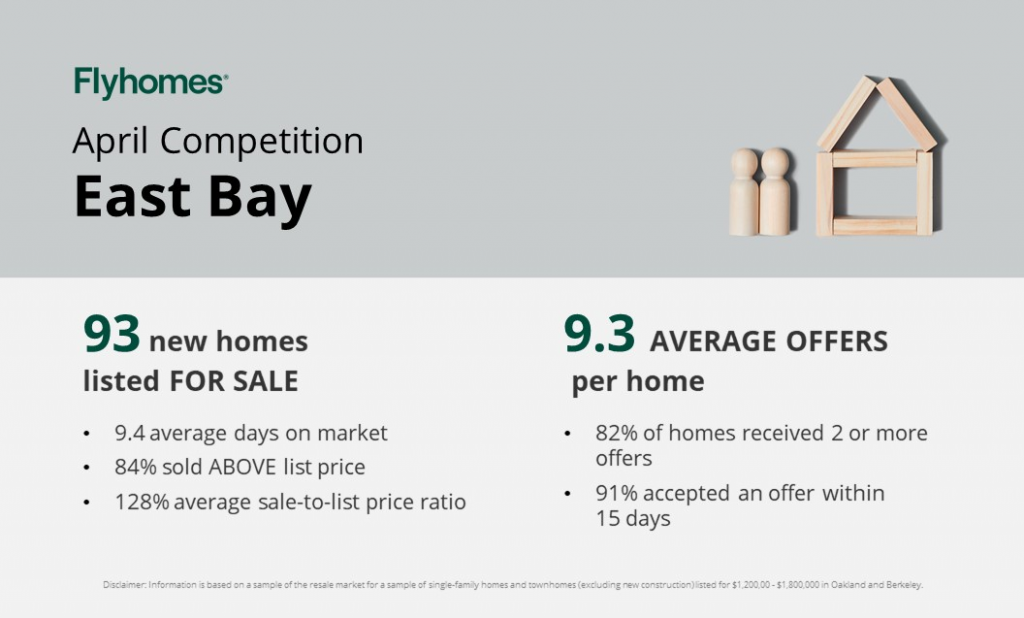
The Bay Area saw new median price milestones in June and continued to experience an active peak season with sale-to-list price ratio for single family homes at a minimum of 110% across the region.
- A milestone high price for San Francisco. San Francisco single family homes jumped 8% month over month to a median sale price of $2.1M, a multi-year high. Meanwhile, median list price dropped 6% from May, indicating that sellers may be intentionally under-listing to gain traction with buyers. 13% fewer single family homes were listed month over month and 24% fewer went pending, indicating that lower inventory may also be inflating sale prices.
- Year-over-year jumps for the East Bay. Median sale price for East Bay single family homes was 21% over last June and a whopping 34% over the $925,000 median in June 2019. Month-over-month, sale price held about steady as the number of homes listed increased by 11%. Without that bump in inventory, sale prices likely would have seen a steep increase as buyers continued to be active.
- The South Bay held steady at its new levels. The South Bay saw no significant changes from May to June, continuing a three-month trend of single family home sale-to-list price ratio at or above 110%, compared with 100% in June of 2020 and 2019. Median days on market also held steady for the third month at 7 days, compared to 11 in June of 2020 and 14 in 2019.
- Peninsula median sale price rose to $2.2M. The Peninsula saw an 18% increase in median sale price for single family homes, coming in at $2.2M. This change may have been due to higher-end properties selling this month or may be a sign of appreciation in the area; the next few months will be telling. Median list prices fluctuated down just 1% and days on market held at a median of 7. Meanwhile, sale to list price increased 3% to a multi-year high of 113%.
Competition snapshot
May 2021
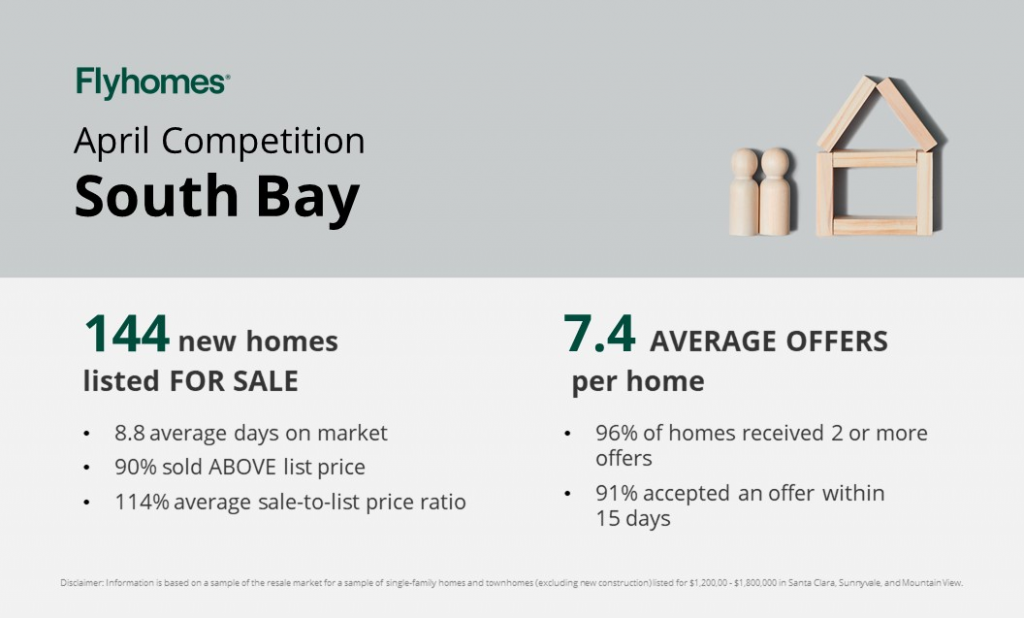
Competition for homes across the Bay Area remains high, with median sale prices far above list and homes spending few days on the market. The pandemic-induced gap between condo inventory and sales has nearly closed, with a whopping 166% jump in pending San Francisco condos year over year.
- Median sale prices are up. Across the region, sale prices for single family homes increased month over month, by as much as 8% in San Francisco. Year over year, we see increases ranging from 16% on the Peninsula to 37% in the East Bay, given that May 2020 was a low point due to the pandemic. Sale prices for San Francisco condos have rebounded above pre-pandemic levels.
- Homes are selling very, very quickly. Median days on market can’t get much lower, holding steady at 11 for San Francisco and East Bay single family homes, and only 7 days for South Bay and Peninsula single family homes.
- Competition remains high. Sale prices for single family homes came in at 109%-124% across the region, marking small changes from last month. The number of single family homes listed and going pending are nearly equivalent, avoiding a severe increase in competition for the month. Last year, condo supply far outpaced demand; we’ve seen that gap nearly close.
Competition snapshot


April 2021
Competition for homes across the Bay Area continues to be very high, and San Francisco is seeing a return to a seller’s market after softening during 2020. Across the region, sale-to-list price ratio for single-family homes is at a multi-year high, indicating that buyers are consistently paying well over list price.
- Condos in San Francisco are almost back to pre-pandemic numbers. Condos are spending only 19 days on the market, a -47% decrease from last year and -48% from the pre-pandemic number of 37 in April 2019. Median sale price is down -6% year over year at $1.21 million, but has increased consistently over the past four months and is just 2% shy of the April 2019 number of $1.23 million. Likewise, sale-to-list price ratio has increased over the past four months and is gaining on pre-pandemic numbers. The number of condos pending dipped slightly as a course correction after months of condo listings outpacing the number going pending.
- The East Bay is super hot. The sale-to-list price ratio for East Bay single family homes in April landed at 122.6%, rocketing 4% month over month and 8% year over year (note that the pandemic played little to no role in this figure in April 2020). Median sale price is up 12% for the month and 26% for the year.
- The Peninsula has picked up steam. With a sale-to-list price ratio of 110.2% for single family homes, up 3% month over month and 5% year over year, buyers are clearly setting sights on the Peninsula. Days on market are down to 7, on par with last year and down 43% from 10 in April 2019, pre-pandemic.
Competition snapshot


March 2021
With the news that a Berkeley home sold for $1MM over list price in March (and that being only one extreme example of the current market trend), it’ll come as no surprise that the Bay Area market remains very competitive for buyers.
- San Francisco list prices haven’t closed the pandemic gap. In San Francisco, median list price has been trending downward since mid-2020 and is still down 9% year-over-year for single family homes. We expect prices to be on par with where they would have been without the pandemic’s effect by this year’s peak season.
- Homes are selling quickly. Median days on market for single family homes are down or steady year-over-year across the region, except in San Francisco, owing to the lag in catching up to pre-pandemic activity (though homes in the city are still selling in a median of 32 days, down 23% from February).
- More homes are selling. The number of single family homes pending and listed rose across the region month-over-month and year-over-year, again with the exception of month-over-month decreases in San Francisco.
- The gap between list price and sale price is growing. In San Francisco, sale-to-list price ratio for single family homes is trending behind 2020, but is up 3% month-over-month. This measure is likewise trending upward for single family homes across the region and reaching multi-year highs in the East Bay, South Bay, and Peninsula.
Competition snapshot


February 2021
The always-competitive Bay Area market ended 2020 on a high note that’s continued at the start of this year.
- San Francisco is no longer the most competitive area in the Bay. The East Bay currently takes that title, followed by the South Bay, and San Francisco is seeing the least competition (though it’s still very competitive). Hotness in the East Bay is likely due to homebuyers who were inspired by working from home because of the pandemic, and who want more space than they’d find in San Francisco.
- Homes are selling for higher prices across the region. Median sale price for single family homes is up year over year by 13% in the East Bay, 9% in the South Bay, 23% on the Peninsula, and 5% in San Francisco. Each area also saw an increase month over month.
- List prices outside of San Francisco are rising. Median list price for single family homes is up year over year in all areas except for San Francisco,where it dropped 19%. Bear in mind that sellers across the Bay Area often underprice homes to drive up competition.
- Sellers continue to list homes significantly under market value. Sale-to-list price ratio for single family homes is between 105% and 114% across the region. San Francisco saw a slight dip year over year from 111% to 110%, but that 110% is a strong showing given that February 2020 was active pre-pandemic. The Peninsula also saw a year over year dip due to a spike last February.
- Homes are selling very quickly. Median days on market for single family homes dropped across the region year over year, except in the South Bay, where they stayed flat. Current numbers between 8 and 25 days across the region reinforce the high levels of competition as local strategy is typically to accept offers for 30 days or more.
Competition snapshot


January 2021
Most of the region shows a continuation of activity from December, particularly the condo market in San Francisco. The East Bay, however, saw more activity than typical.
- December’s competitiveness carried over to January. Across the Bay Area, we saw little change in median sale price month over month, showing a continuation of activity from December. Year over year, prices jumped, indicating that 2021 is off to a competitive start thanks to the same momentum from the end of 2020. The Peninsula is an exception with year over year flatness.
- The San Francisco condo market is still slow. Year over year, list price for condos is down 11.20%. List price usually decreases for one of two reasons: the market slowing or increased competition encouraging sellers to under-list expecting bidding wars. In this case, days on market remained flat month-over-month, indicating that competition is not increasing. Falling list prices are likely a holdover from the covid impact of increased condo listings in 2020. Likewise, the sale-to-list price ratio for both condos and single-family homes in San Francisco is down month over month, indicating a slow decrease in competition.
- Expect multiple offers in the East Bay. This area heated up the most from the pandemic and continues to see decreasing days on market paired with year-over-year increases in sale-to-list price ratio as the area sees a shortage of inventory for the number of active buyers.
- February will be telling. Across the region, we saw mostly flat month-over-month numbers of properties pending and days on market while numbers of properties listed rose. February will tell us if this extra inventory will be absorbed by increased demand or if the market will slow slightly, which is unlikely with spring fast approaching.
Competition snapshot


