Real estate data for Seattle and the Eastside
Current month’s highlights and full data
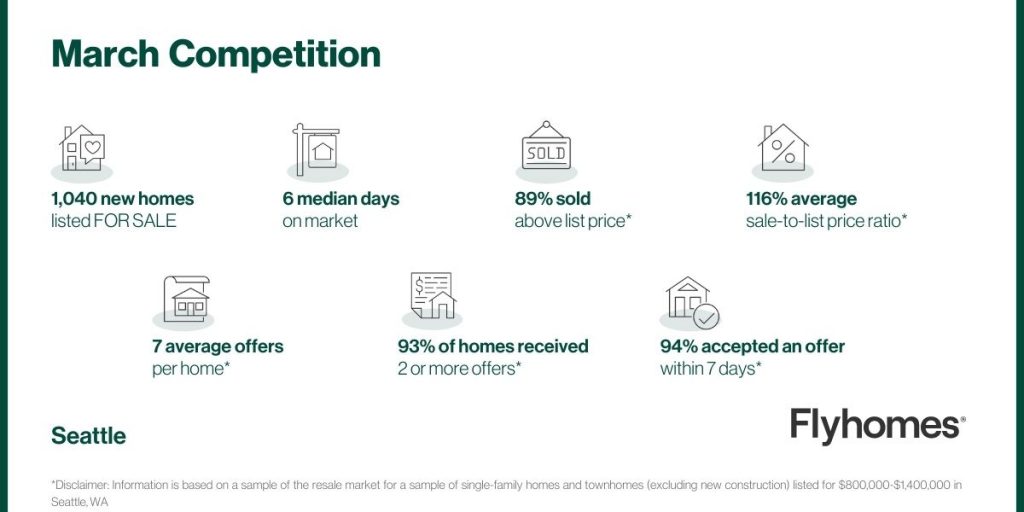
Buyer demand fed seller confidence in the King County housing market in March. Despite a spike in the amount of listed homes, inventory was still nearly as flat as it had been in previous months with almost every house listed was pending within six days. On top of that, sale and list prices both rose, indicating a willingness by buyers to spend more for the limited inventory available, despite the rise in interest rates.
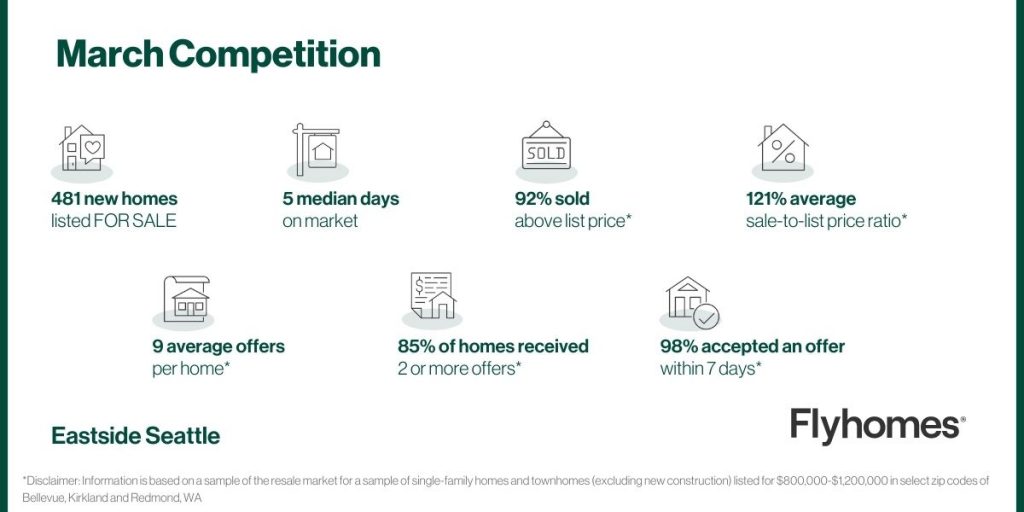
- The number of homes listed rose in parallel to the amount of homes sold Though the amount of listed homes rose to over 1,000 in Seattle and nearly 500 on the Eastside, inventory remained nearly flat. Homes sold at nearly an identical rate as pending sales, with most homes selling in under a week.
- Selling prices in Seattle broke records The median selling price of a single-family home or townhouse in Seattle hit an all-time record in March after rising 18% to $935,000. Meanwhile, sale prices on the Eastside dipped by just 8%, holding at $1.6 million.
- Competition remained strong on both sides of the lake Buyers were closing on homes as much as 18% above list price on the Eastside while homes all over King County sold in an average of six days with nearly record high offers.
- Condo prices in Seattle remained relatively flat but beginning to creep up Following a yearly high in 2021 of $624,000 in October, condo prices reached $525,000 in March of this year, after creeping up steadily from $515,000 at the beginning of the year.
February 2022 highlights
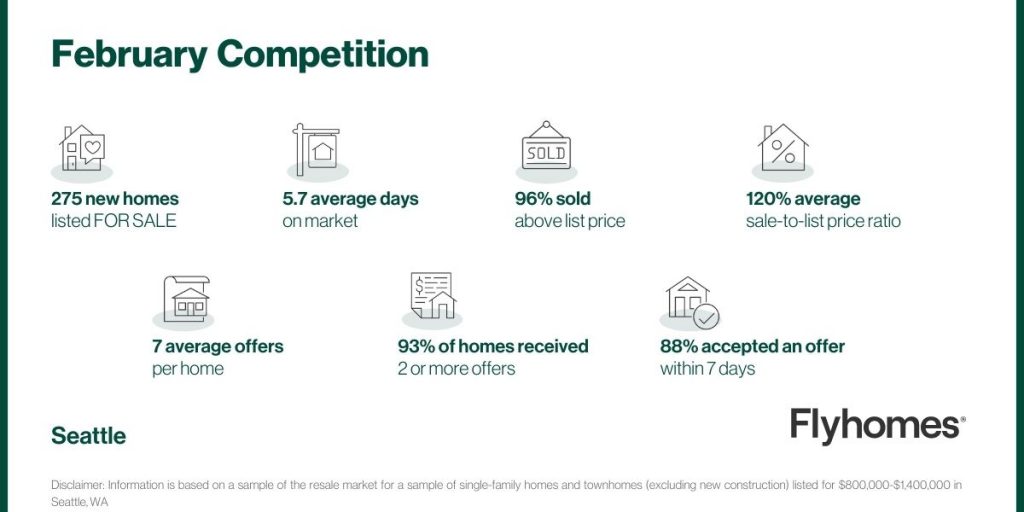
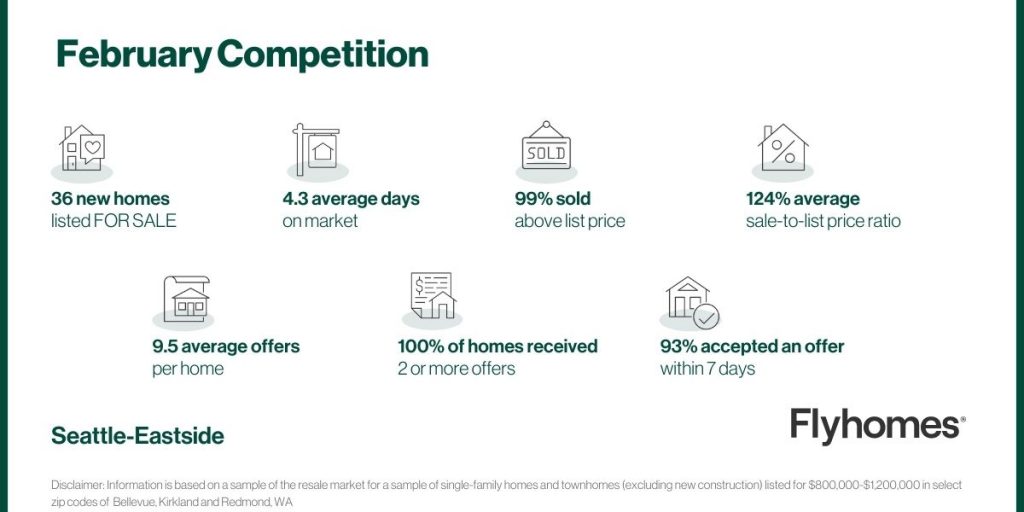
The housing market in King County picked up a lot of steam in February, recovering from an end-of-year slow down to bounce back with a vengeance. It’s tough to parse out what is an increase due to inflation and what is due to the natural market cycle, but the 14% rise in prices from January to February this year far outpaces the increases in the same time period for the previous two years. Most metrics point to tighter competition with prices rising, inventory staying flat, and homes selling relatively quickly in both Seattle and on the east side of Lake Washington.
- Home prices rose at a greater rate this month than in the previous two years Average home prices closed out January on the low end of the market cycle at just under $770,000. But prices rose by more than 14% to hit nearly $890,000 between January and February of this year. Meanwhile, prices only rose 1% and 1.5% in the same time period in 2021 and 2020, respectively.
- Competition on the Eastside kept pace with Seattle The average selling price of a home on the Eastside rose by 15% from January to February. That increase was as equally uncharacteristic for the time period as the previous years saw a smaller jump.
- Inventory was almost perfectly flat despite the rise in prices Sellers responded to increasing selling prices by listing more homes. Instead of driving up inventory and calming competition, buyers bought homes within 6 days on average, keeping inventory flat.
- Buyers were willing to pay higher prices to win bids on homes The sale-to-list-price ratio was above 100% on both sides of Lake Washington, with the Eastside homes selling, on average, nearly 20% higher than their list price.
January 2022 highlights
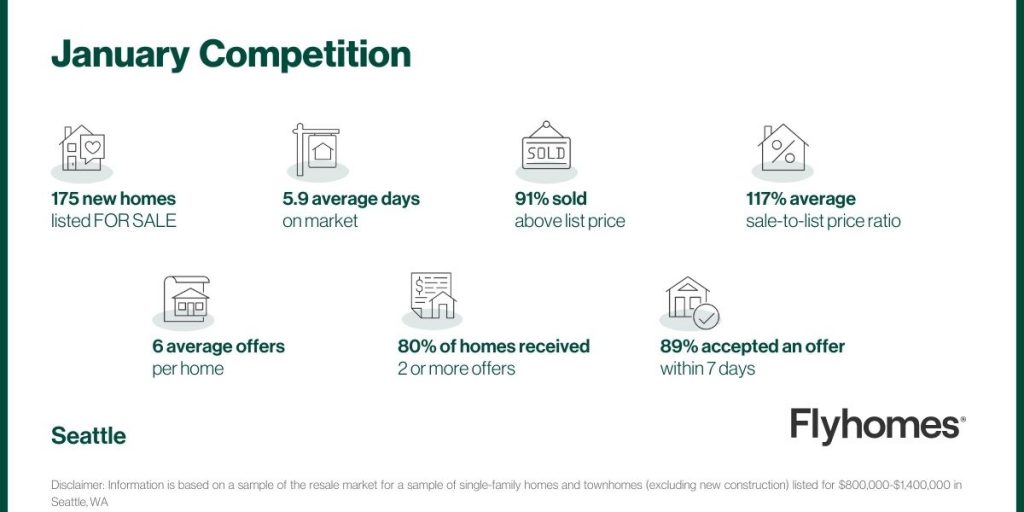
Following an end-of-year slow down in the market, competition crept back up in the first month of the new year across all of King County. In Seattle proper, sale prices rose nearly 15% and list prices kept base, rising by nearly 8%. Meanwhile, on the Eastside, sale prices dipped but stayed well above list price as homes sold in under a week, on average.
December 2021 Highlights
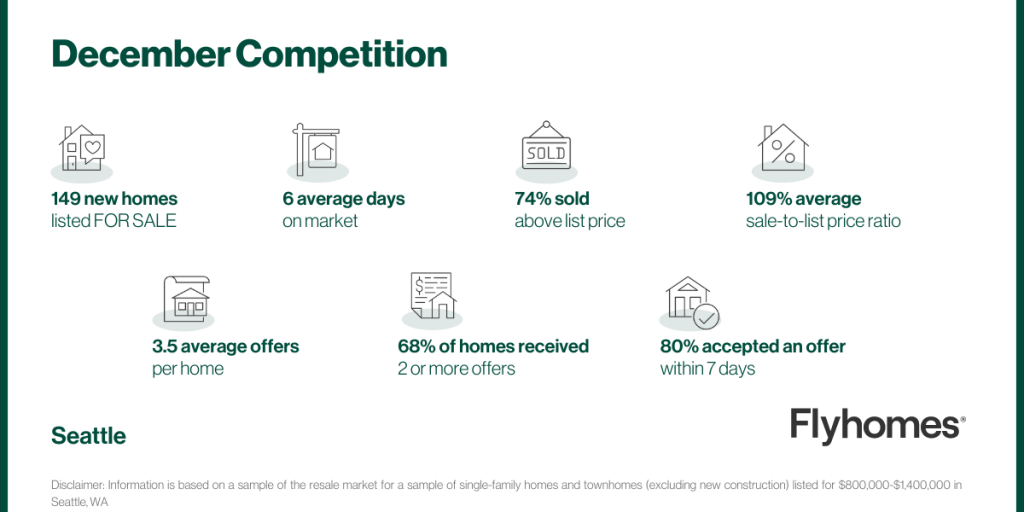
Overall, the market remained steady in the middle of its slow winter season in and around Seattle. Sale prices were still low for the year but didn’t experience much movement in either direction from November to December. But competition showed some signs of increasing into the new year as the number of listed homes dropped 34% from November while the number of homes being sold kept pace, leading to a lower inventory.
- Inventory decreased in December in the Seattle area In November, sellers in Seattle listed over 580 homes but that number dropped 34% to just over 380 in December. But the rate of buying didn’t budge much leading to a lower inventory.
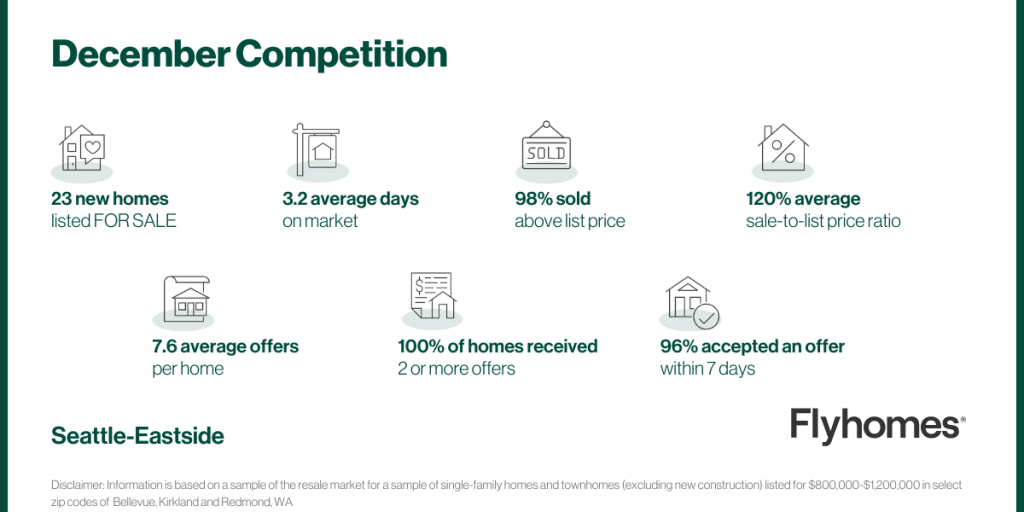
- The Eastside remained competitive For the eighth month in a row, homes spent only five days on the market on the Eastside near Bellevue and Redmond. Both the number of homes listed and sold dipped by the same rate, ensuring that most metrics held despite nearby areas seeing a downward trend in both sales and list price. The Eastside is still the more competitive area for the Seattle metro region.
- The demand for multi-family homes in Seattle dipped The sale price for condos in Seattle slid to 98% of their list price for a median price of $492,000—a nearly 7% drop from November.
November 2021 highlights
The Seattle area continued its trend toward a steadier and slower pace that began in the fall. As expected, the number of homes sold and listed were both down while the list-to-sale-price ratio was smaller at 102%. The same can be said of the Eastside where median sales prices were steady at $1.4 million.
October 2021 highlights
The Seattle area overall saw fewer homes listed and less activity in October than in September, as is expected. One exception: Eastside single family homes saw clear increases in activity and median price, and a slight uptick in competition.
- Seattle has entered the slow season. Median days on market rose 17% for single family homes and 18% for condos, typical for October in Seattle. Sale to list price ratio held steady while the number of properties listed dropped.
- Single family homes on the Eastside saw a price surge. Despite having appeared last month to be cooling for the fall, the median sale price for single family homes jumped 8% to $1,410,000—a multi-year high. October 2019 and 2020 brought similar, though smaller, bumps in sale price. Median days on market held steady, and sale-to-list price rose slightly.
- The condo market on the Eastside softened. The number of properties listed and pending dropped month over month. While median sale price dropped 8% month over month rather than a spike like we saw in October 2020, the overall trend over the past two years is upward, indicating that Eastside condos are appreciating in value.
September 2021
Seattle and the Eastside both saw typical September trends with the market adjusting for a post-peak decrease in activity.
- More listings in Seattle, but not more competition for buyers. In Seattle, 23% more single family homes were listed than in August as sellers tried to get ahead of the fall slowdown. This bump in September inventory is typical for years prior to 2020. Homes continued to sell in a median of only six days, but at a 5% lower median price and at a flat sale-to-list price ratio.
- The Eastside settled into its slower season. On the Eastside, 21% fewer single family homes were listed than in August. An August/September decrease in inventory is typical on the Eastside, so this change isn’t unexpected. While median list price rose 8% month over month, median sale price dropped 2%. Homes continued to sell at a quick median of 5 days. Despite a 1% increase in sale-to-list price ratio likely caused by a few standout homes, competition for buyers stayed about steady.
- Condo sales on the Eastside were more active than single family home sales. Condos on the Eastside stayed on the market for a median of 8 days, down 11% from August, indicating that there is urgency among buyers. 13% fewer condos were listed month over month and median sale price rose 7%, likely due to decreased inventory.

August 2021
While 2020 brought an extended peak season to King County, August 2021 showed the typical signs of an expected seasonal slowdown, despite homes continuing to sell at a quick pace.
- Single family homes are still selling quickly. The median number of days on market for Seattle single family homes in August was 6 days, down from 7 in July and back on par with the consistent speed since February. On the Eastside, the median held steady at 5 days, where it’s been since January.
- Competition has cooled slightly. The sale-to-list price ratio for single family homes in Seattle dropped to 103% from 104% in July. Meanwhile, Eastside single family homes saw a ratio of 107%, down from 110%. While both of these numbers mark a month-over-month decline, the ratios are still well above pre-pandemic rates. The August 2019 ratio in Seattle was 97%; on the Eastside, it was 98%.
- Seattle inventory returned to the pre-pandemic trend. In 2020, the peak of the Seattle market shifted later in the year to peak in July/August versus the usual May/June. Year over year, the number of properties listed in August dropped 28%. This difference signifies a return to the pre-pandemic trend of a May/June peak.

July 2021
In July, the Seattle and Eastside markets both showed the first signs of seasonal slowing after the summer homebuying peak. Low activity over the Fourth of July weekend also contributed to a slight slowdown compared to recent months.
- Seattle sale and list prices were almost flat from June. The median sale price for single family homes and condos in Seattle fluctuated down 1% month over month. Likewise, sale-to-list price ratio dipped 1%. The $866K median for single family homes represents an 11% increase over July 2020 as this summer continues to trend well above last year. Median list price for single family homes likewise fluctuated down 1%, while condos saw a slightly bigger 3% downward fluctuation month over month, dipping 8% year over year.
- Homes are spending more days on the market in Seattle. Median days on market for single family homes rose to seven days. This change marks only a one-day increase, but the six-day median has held steady since February, making the 17% lift is a significant change. For condos, median days on market jumped 63% to 13 days, but they are simply returning to the range of previous months after reaching a dramatic low of eight days in June.
- Eastside single family home inventory diluted competition. Single family homes continued to sell at a median of only five days, but we saw signs of seasonal slowdown.In June, the number of new homes listed jumped 24%. July saw an 8% dip from that high, but remained above previous months. Meanwhile, sale-to-list price ratio decreased 1% month over month, indicating that this new level of supply wasn’t met with a new level of demand. Median list price and sale price also saw downward fluctuations.
Competition snapshot

June 2021
Across the region, the market continued to see a high level of activity. While June didn’t bring month-over-month jumps, the area remains a seller’s market.
- Seattle prices were steady from May to June. In Seattle, median sale price for single family homes saw a small downward fluctuation but remained 16% above the pre-pandemic June 2019 number of $755,000.
- Eastside prices rose. On the Eastside, single family home median sale price picked up 5% month over month to a multi-year high of $1.4M. Meanwhile, list price held steady, indicating that the higher sale prices were driven by increased competition.
- Homes sold very quickly. Across the region, homes sold about as quickly as possible regardless of property type, with a median of 6 days for single family homes in Seattle, 5 days for Eastside single family homes, and 6 days for Eastside condos. Condos in Seattle were an exception, at a median of 10 days, on par with June 2020.
- The Eastside condo market picked up. Sale-to-list price ratio for condos on the Eastside came in at a median of 103%, a multi-year high and the third consecutive month of an over-100% trend. The number of condos listed and pending remained about steady indicating that this ratio is driven by buyer interest and not a decrease in inventory.
Competition snapshot
May 2021
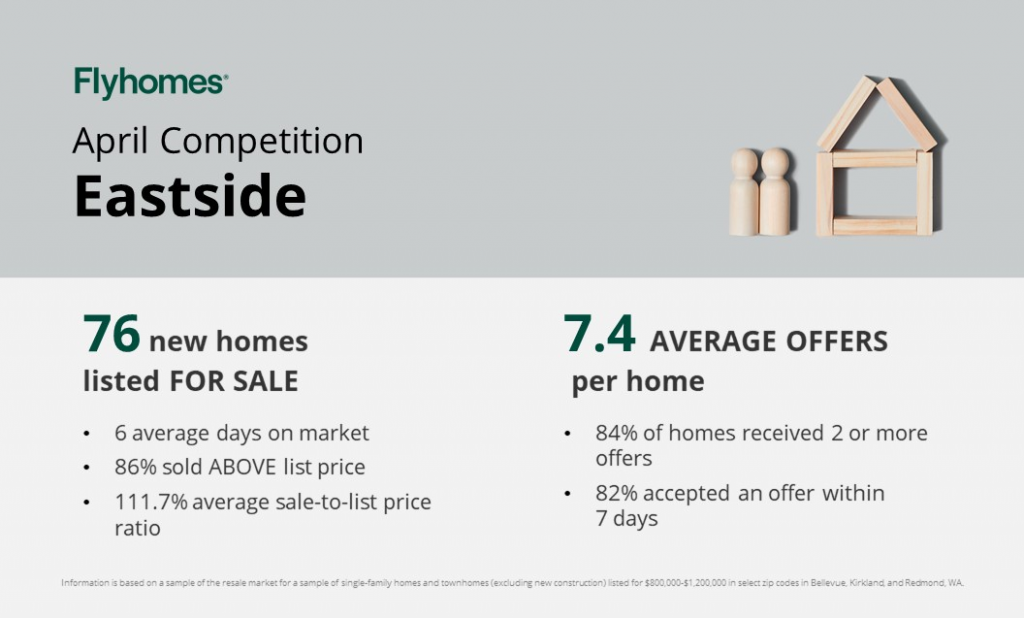
Competition for homes continues to be hot in Seattle and on the Eastside, with demand outpacing supply. Buyers should expect single family homes to sell well over list price, as sale prices rose slightly month over month to 107% of list prices in Seattle and 111% on the Eastside.
- Median sale prices are up. Last year in May, the market was affected by the onset of the pandemic, which gives us huge year over year increases in median sale price for single family homes (21% in Seattle and 35% on the Eastside). Month over month, sale prices continue to trend upward.
- Homes continue to sell very quickly. Median days on market saw no change, remaining at only six days for single family homes in Seattle and five on the Eastside.
- The gap between demand and supply grew. In Seattle, the number of single family homes listed remained nearly steady (decreasing -0.37%) month over month while 11% more homes weent pending. On the Eastside, single family home listings decreased by 5%, while 9% more went pending.
- The Eastside condo market is picking up. Sellers listed 57% more condos in May 2021 compared to 2020, and a whopping 95% more went pending, showing buyer confidence in condos. This may indicate that we’re past the point of avoiding closer living spaces due to the pandemic.
Competition snapshot

April 2021
Competition for homes in Seattle continues to be high and it’s even higher on the Eastside. Across the region, the market is seeing a return to pre-pandemic seasonal activity, and is more crowded than before the pandemic.
- Single family homes continue to sell quickly. Homes are spending very few days on the market.The month-over-month median numbers saw little change across property types, given that the numbers are already very low, at 6 days for single family homes in Seattle and 5 on the Eastside.
- Buyers are paying well over list price. Sale-to-list price ratio is at a multi-year high for single family homes in Seattle (106.5%) and on the Eastside (111.2%). Condos are less competitive, but still selling at a 99% ratio in Seattle (up 1.0% month over month) and 101.1% on the Eastside (up 1.6%).
- Sale and list prices are up for single family homes. In Seattle, sale prices are up 5.3% month-over-month and 6.6% year-over-year. List prices are up 6.3% for the month and 9.7% for the year. The Eastside saw a dip in April 2020, driving a larger year-over-year gap at 34.7% for sale price and 22.4% for list price.
- Supply is limited on the Eastside. The number of single family homes listed on the Eastside in April was 507, an increase of 64.6% from last year, but that gap is largely due to the pandemic. In April 2019, 504 were listed. With the number of new listings roughly equal to pre-pandemic, we’re seeing lower days on market (5 compared to 7 in 2019), indicating that the same volume of homes is selling more quickly.
Competition snapshot

March 2021
The Seattle-area market continues to be the most active it’s been in years with homes selling above list price, and inventory remains scarce despite more listings entering the market. Homes are selling very quickly with high buyer demand.
- Listings in Seattle are up. Seattle saw 50% more single family home listings month-over-month and 29% year-over-year, illustrating that sellers are confident in the market and not holding out for the typical peak season. It remains to be seen if additional sellers are also listing who wouldn’t be selling at all save for the opportunity to review multiple offers.
- More homes are selling, and quickly. The number of single family homes pending in Seattle rose 39% month-over-month and 66% year-over-year and median days on market held at 6 days. The new listings are being sold quickly, not rolling over to create a greater selection month-over-month for buyers.
- Eastside single family homes see a similar trend. Eastside single family homes see parallel numbers to Seattle’s, with a steady median of 5 days on market, 68% more single family homes pending month-over-month, and 60% more pending year-over-year.
- Condos may be a less stressful target for homebuyers. For both Seattle and the Eastside, the condo market is seeing less hotness and is maintaining a sub-100% sale-to-list price ratio.
Competition snapshot

February 2021
The local market is extremely competitive with median sale prices coming in higher—and homes selling further over list price—than at the same time last year.
- Buyers are paying more for homes. Median sale price for single family homes is up 8% year-over-year in Seattle and 22% on the Eastside. While you can find areas in Seattle that are relatively less competitive, the Eastside is highly competitive across the board. In both places, we see the same trend of rising prices that we saw pre-pandemic in 2020, but with a higher starting point carrying over from activity at the end of 2020.
- Sellers are listing under market value. The year-over-year change in median list price for single family homes comes in at a 6% increase in Seattle and a decrease of 1% on the Eastside. You might expect list prices to jump as sale prices increase. However, in this region, sellers often price homes below market value to encourage competition (which drives up the price). Expect to see this strategy employed more often as the spring season approaches.
- Expect to add at least 3% to the list price of a single family home. Sale-to-list price ratio for single family homes in Seattle increased 2% year over year to 102.6%. On the Eastside, the jump was even bigger, going from 102% to 108%.
- Single family homes are selling very quickly. Median days on market dropped to 6 days for single family homes and 9 days for condos in Seattle. On the Eastside, they stayed at 5 days for single family homes and dropped to 10 days for condos. About 4 days on market is as low as this number can go, so single family homes in the region are selling about as fast as it’s possible to sell.
- More homes are selling than are being listed. The number of single family homes pending increased 28% year over year in Seattle and 12% on the Eastside. At the same time, the number of homes newly listed in the month was up 7% in Seattle year over year and down 5% on the Eastside. The number of pending homes outpacing the number listed reflects high demand in the area; homes are being sold in the same month they’re listed.
Competition snapshot

January 2021
The local market is off to an active start in 2021. Because of the extended peak season last year, the market in December was warmer than usual and that trend continued into January.
- Buyers in Seattle should expect competition. The median sale price of single-family homes and townhomes saw a small lift (just under 1%) from December and strong 7.75% growth year over year. Likewise, median days on market dropped 56% month over month, from 16 days in December to 7 in January.
- List prices on the Eastside dropped because of seller confidence. Median list price fell both month over month and year over year for single family homes, townhomes, and condos on the Eastside … but it’s not because the market is soft. It’s likely due to sellers using the strategy of underpricing in order to increase competition because they’re confident that the market will bring multiple buyers.
- Sale-to-list price is steady in the region. Both Seattle and the Eastside saw minimal month-over-month change in sale-to-list price ratio for all property types. This flatness reflects December’s relative strength rather than a lack of competition in January. The year-over-year change was larger (2.20% for single-family homes in Seattle and 4.37% for single-family homes on the Eastside) because of lingering competitiveness from the end of 2020.
Competition snapshot

